Money The graph shows a proportional
relationship between a person's total savings in
dollars...

Mathematics, 12.02.2021 07:40 jasmindelvalle78
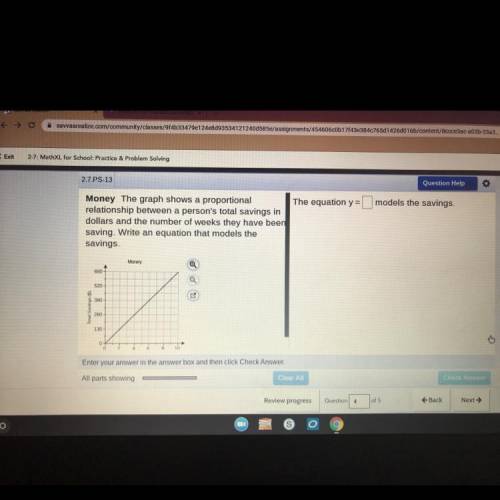
Money The graph shows a proportional
relationship between a person's total savings in
dollars and the number of weeks they have been
saving. Write an equation that models the
savings.
Money
650
520
390
Total Savings (5)
260
130
0-
6 R
10

Answers: 2


Other questions on the subject: Mathematics
Mathematics, 21.06.2019 18:30, allenlog000
Can someone me out here and the tell me the greatest common factor
Answers: 1
Mathematics, 21.06.2019 20:30, qveenvslayin
Erin bought christmas cards for $2 each to send to her family and friends. which variable is the dependent variable?
Answers: 1
You know the right answer?
Questions in other subjects:


Mathematics, 08.06.2021 20:20


