
Mathematics, 12.02.2021 07:20 Yvette538
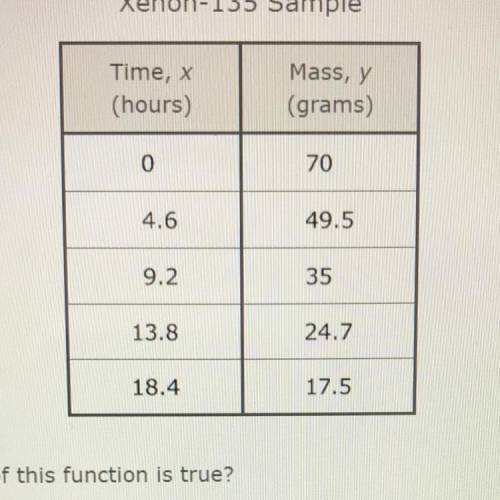
The table represents some points on the graph of the exponential function that models the radioactive decay of a
sample of xenon-135.
Xenon-135 Sample
Time, x
(hours)
Mass, y
(grams)
0
70
4.6
49.5
9.2
35
13.8
24.7
18.4
17.5
Which statement about the graph of this function is true?

Answers: 2


Other questions on the subject: Mathematics
Mathematics, 21.06.2019 16:30, danjan9084
One of the same side angles of two parallel lines is 20° smaller than the other one. find the measures of these two angles.
Answers: 3
Mathematics, 21.06.2019 17:00, alexandraschwartz21
Aswimming pool is a rectangle with semicircles on the end. the rectangle is 12 meters wide and 30 meters long. the diameter and width of the swimming pool are equal. sketch and label an overhead diagram of the swimming pool. find the area of the swimming pool floor.
Answers: 1
Mathematics, 21.06.2019 18:30, BreBreDoeCCx
Solve the system of equations y= 3/2 - 1, -x+ y =-3
Answers: 1
Mathematics, 21.06.2019 20:30, stgitskaysie9028
Write an expression that represent sarah’s total pay last week. represent her hourly wage with w monday 5 tuesday 3 wednesday 0 noah hours wednesday 8 only with w wage did noah and sarah earn the same amount last week?
Answers: 3
You know the right answer?
The table represents some points on the graph of the exponential function that models the radioactiv...
Questions in other subjects:

English, 09.01.2021 01:20
Mathematics, 09.01.2021 01:20
Mathematics, 09.01.2021 01:20

Mathematics, 09.01.2021 01:20

Chemistry, 09.01.2021 01:20


