Multiple choice : )
which graph best represents the feasibility region for the system shown ab...

Mathematics, 05.02.2020 10:50 suevazpue
Multiple choice : )
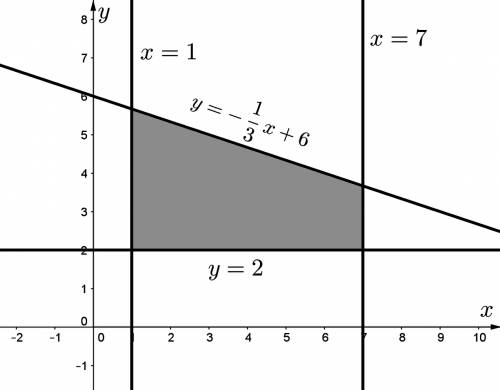
which graph best represents the feasibility region for the system shown above?
x_1
x_7
y_2
y_ - 1/3x + 6

Answers: 3


Other questions on the subject: Mathematics
Mathematics, 21.06.2019 14:00, jamaiciaw6
Algebra 1: unit 6 part 2 of test a) the table shows a linear function. x 0 1 2 3 5 13 21 29 37 45 53 (a) determine the difference of outputs of any two inputs that are 1 unit apart. show your work. (b) determine the difference of outputs of any two inputs that are 2 units apart. show your work.
Answers: 2
Mathematics, 21.06.2019 16:00, alex12everett
What is the solution to the system of equations? (–2, –8) (–1, –5) (0, –2) (2, 4)
Answers: 3
Mathematics, 21.06.2019 20:00, PastryCrisp
The function f(x) = 14,600(1.1)* represents the population of a town x years after it was established. what was the original population of the town?
Answers: 1
Mathematics, 21.06.2019 20:00, jhernandezvaldez142
Michelle and julie work at a catering company. they need to bake 264 cookies for a birthday party that starts in a little over an hour and a half. each tube of cookie dough claims to make 36 cookies, but michelle eats about 1/5 of every tube and julie makes cookies that are 1.5 times as large as the recommended cookie size. it takes about 8 minutes to bake a container of cookies, but since julie's cookies are larger, they take 12 minutes to bake. a. how many tubes should each girl plan to bake? how long does each girl use the oven? b. explain your solution process what did you make? c. what assumptions did you make?
Answers: 2
You know the right answer?
Questions in other subjects:


Business, 09.03.2021 23:10
Mathematics, 09.03.2021 23:10
English, 09.03.2021 23:10


English, 09.03.2021 23:10
History, 09.03.2021 23:10
Mathematics, 09.03.2021 23:10


