Mathematics, 12.02.2021 02:00 Schoolwork100
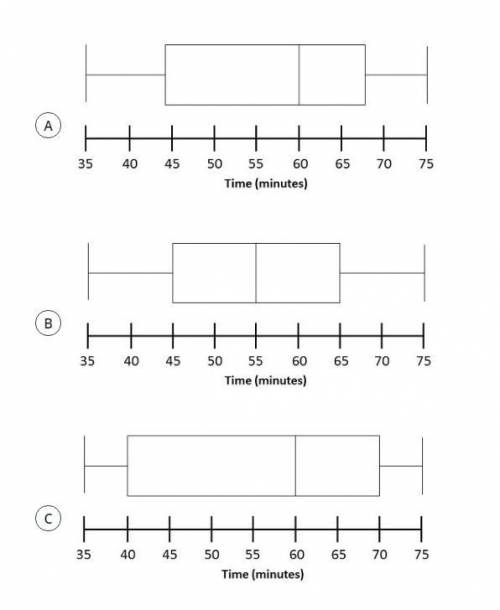
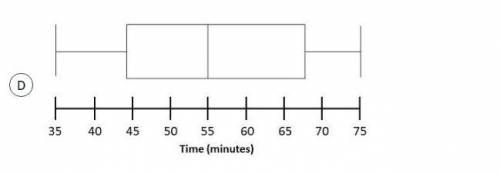
The data below represent the number of minutes that people each spent on their phones in one day.
35, 37, 40, 44, 45, 45, 50, 60, 65, 65, 65, 70, 72, 75
Which box plot represents the data?


Answers: 2


Other questions on the subject: Mathematics


Mathematics, 21.06.2019 15:30, superstarsara5ouh83x
Write an equation of a line in slope intercept form that is perpendicular to the line 2x -3y = 12 and passes through the point (2, 6).
Answers: 3

Mathematics, 21.06.2019 21:10, Ahemingway7164
Mackenzie needs to determine whether the rectangles are proportional. which process could she use? check all that apply.
Answers: 1
You know the right answer?
The data below represent the number of minutes that people each spent on their phones in one day.
...
Questions in other subjects:

Mathematics, 09.09.2020 06:01

History, 09.09.2020 06:01

Mathematics, 09.09.2020 06:01

Mathematics, 09.09.2020 06:01


Mathematics, 09.09.2020 06:01

Mathematics, 09.09.2020 06:01

German, 09.09.2020 06:01

Mathematics, 09.09.2020 06:01


