
Mathematics, 11.02.2021 23:20 itssdaen
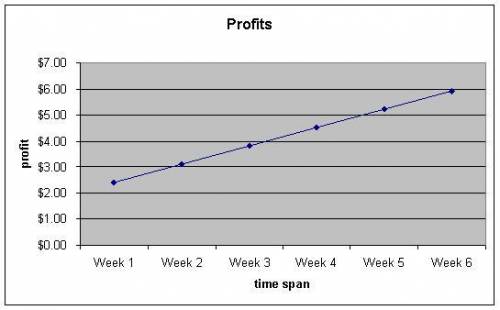
The line graph below shows the profits of Carol's lemonade stand over the past six weeks.
A) $6.60
B) $7.30
C) $8.00
D) $8.70
If her profits continue to increase at the same rate, what will her profit be on the 10th week?

Answers: 1


Other questions on the subject: Mathematics
Mathematics, 21.06.2019 15:30, groverparham3
Is each relation a function? if so, state whether it is one-to-one or many-to-one. 3. (-4,7), (-3,5), (1,4), (3,-8), (5,-11) 4. (-4,8), (-2,4), (0,1), (2,4), (4,8) 5. (-2, 1), (-2,3), (0,-3), (1,4), (3,1)
Answers: 3
Mathematics, 21.06.2019 21:10, madisontrosclair2
Plot a point at the y-intercept of the following function on the provided graph. 3y=-5x+7 20 points
Answers: 1
You know the right answer?
The line graph below shows the profits of Carol's lemonade stand over the past six weeks.
A) $6.60<...
Questions in other subjects:


