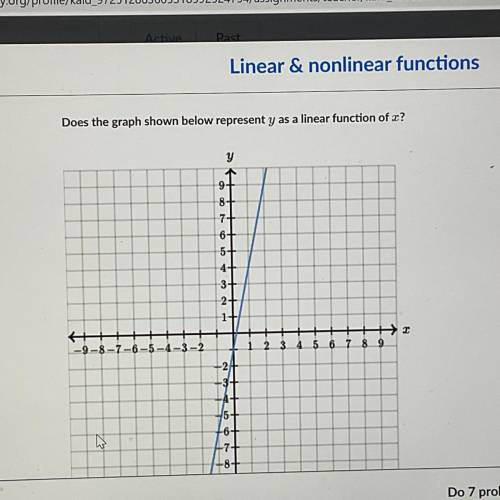
Does the graph shown below represent Y as a linear function of X DUE BY 3PM
...

Mathematics, 11.02.2021 20:20 HotWheels162000
Does the graph shown below represent Y as a linear function of X DUE BY 3PM

Answers: 3


Other questions on the subject: Mathematics
Mathematics, 21.06.2019 12:30, faith365
Aschool typically sells 500 yearbooks each year for 50 dollars each. the economic calls does a project and discovers that they can sell 100 more yearbooks for every $5 decrease in price. the revenue for yearbook sales is equal to the number of yearbooks sold times the price of the yearbook. let x represent the number of $5 decrease in price. if the expression that represents the revenue is written in the form r(x)=(500+ax)(50-bx). to maximize profit, what price should the school charge for the yearbooks? what is the possible maximum revenue? if the school attains the maximum revenue, how many yearbooks will they sell?
Answers: 3
Mathematics, 22.06.2019 01:30, karsenbeau
Given are five observations for two variables, x and y. xi 1 2 3 4 5 yi 3 7 5 11 14 which of the following is a scatter diagrams accurately represents the data? what does the scatter diagram developed in part (a) indicate about the relationship between the two variables? try to approximate the relationship betwen x and y by drawing a straight line through the data. which of the following is a scatter diagrams accurately represents the data? develop the estimated regression equation by computing the values of b 0 and b 1 using equations (14.6) and (14.7) (to 1 decimal). = + x use the estimated regression equation to predict the value of y when x = 4 (to 1 decimal). =
Answers: 3
You know the right answer?
Questions in other subjects:

English, 19.10.2021 02:00

Mathematics, 19.10.2021 02:00


Chemistry, 19.10.2021 02:00

Health, 19.10.2021 02:00


