
Mathematics, 11.02.2021 14:00 demigod0701
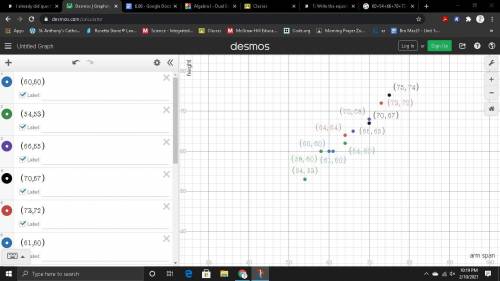
Which variable did you plot on the x-axis, and which variable did you plot on the y-axis? Explain why you assigned the variables in that way.
Write the equation of the line of best fit using the slope-intercept formula $y = mx + b$. Show all your work, including the points used to determine the slope and how the equation was determined.
What does the slope of the line represent within the context of your graph? What does the y-intercept represent?
Test the residuals of two other points to determine how well the line of best fit models the data.
Use the line of best fit to help you to describe the data correlation.
Using the line of best fit that you found in Part Three, Question 2, approximate how tall is a person whose arm span is 66 inches?
According to your line of best fit, what is the arm span of a 74-inch-tall person?

Answers: 3


Other questions on the subject: Mathematics
Mathematics, 21.06.2019 16:00, ashl3yisbored
Determine the mean and variance of the random variable with the following probability mass function. f(x)=( 729divided by 91) (1 divided by 9) superscript x baseline comma x equals 1,2,3 round your answers to three decimal places (e. g. 98.765).
Answers: 3
Mathematics, 21.06.2019 23:30, jasminejohnson4330
The table shows the number of hours orlando spent at football practice last week. select the appropriate numbers below to complete the model to find the number of hours orlando spent practicing on tuesday and friday.
Answers: 2
Mathematics, 22.06.2019 00:10, Ackussinglake63
What is the best estimate of the length of a football
Answers: 1
Mathematics, 22.06.2019 03:00, paula1172
The first triangle is dilated to form the second triangle. select true or false for each statement. statement true false the scale factor is 0.625. the scale factor is 1.6. a right triangle with a side length of .5. an arrow points to a larger right triangle with a side length of .8
Answers: 3
You know the right answer?
Which variable did you plot on the x-axis, and which variable did you plot on the y-axis? Explain wh...
Questions in other subjects:

Mathematics, 19.02.2021 04:50


History, 19.02.2021 04:50
Mathematics, 19.02.2021 04:50
History, 19.02.2021 04:50
Mathematics, 19.02.2021 04:50

Social Studies, 19.02.2021 04:50


