
Mathematics, 11.02.2021 01:50 peachijmin
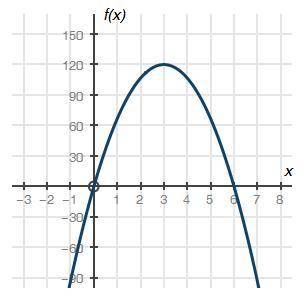
The graph below shows a company's profit f(x), in dollars, depending on the price of pens x, in dollars, sold by the company:
Graph of quadratic function f of x having x-intercepts at ordered pairs 0, 0 and 6, 0. The vertex is at 3, 120.
Part A: What do the x-intercepts and maximum value of the graph represent? What are the intervals where the function is increasing and decreasing, and what do they represent about the sale and profit? (4 points)
Part B: What is an approximate average rate of change of the graph from x = 3 to x = 5, and what does this rate represent? (3 points)
Part C: Describe the constraints of the domain. (3 points)

Answers: 2


Other questions on the subject: Mathematics
Mathematics, 21.06.2019 19:30, gyliahicks
Jada has a meal in a restaurant she adds up the prices listed on the menu for everything they ordered and gets a subtotal of $42.00. after tax the total is 45.99. what percentage of the subtotal is the total?
Answers: 2
Mathematics, 21.06.2019 22:20, stalley1521
Which of the following is missing in the explicit formula for the compound interest geometric sequence below?
Answers: 1
Mathematics, 21.06.2019 23:00, kaleahlove13
Delbert keeps track of total of the total number of points he earns on homework assignments, each of which is worth 60 points. at the end of the semester he has 810 points. write an equation for delbert’s average homework score a in terms of the number of assignments n.
Answers: 3
You know the right answer?
The graph below shows a company's profit f(x), in dollars, depending on the price of pens x, in doll...
Questions in other subjects:
Mathematics, 19.10.2021 14:00

Computers and Technology, 19.10.2021 14:00
Mathematics, 19.10.2021 14:00
Mathematics, 19.10.2021 14:00

Mathematics, 19.10.2021 14:00

Social Studies, 19.10.2021 14:00


