
Mathematics, 10.02.2021 23:30 sofia3226
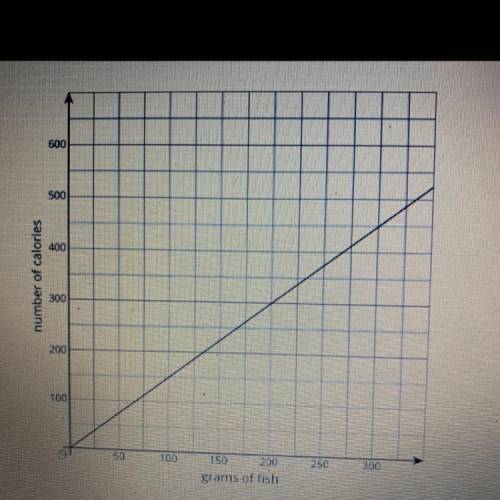
Photo Attached- Here is a graph of the proportional relationship between calories and grams of fish. What is the equation that reflects this unit rate the number of calories per gram of fish) using x to represent the amount of fish in grams and y to represent the number of calories. Write the equation in ymx form. Make sure there are no spaces in between the character's.

Answers: 2


Other questions on the subject: Mathematics
Mathematics, 21.06.2019 23:30, jdenty3398
The graph of the the function f(x) is given below. find [tex]\lim_{x \to 0\zero} f(x)[/tex] [tex]\lim_{x \to 1+\oneplus} f(x)[/tex] [tex]\lim_{x \to 0-\zeroneg} f(x)[/tex]
Answers: 1
Mathematics, 22.06.2019 01:30, tingzontumbler8412
Find the vertex for the parabola given by the function ƒ(x) = −3x2 − 6x.
Answers: 2
Mathematics, 22.06.2019 04:10, Mercedes12152002
What is the slope-intercept from of the equation y+5=4(x+8)?
Answers: 2
Mathematics, 22.06.2019 04:40, kdobi
This assignment is past the original due date o this data is from a sample. calculate the mean, standard deviation, and variance 16.7 11.1 46.7 14.8 13.3 16.6 18.5 47.3 42,8 show the following answers to 2 decimal places. sample mean- sample standard deviation ( use the standard deviation above for your calculation.) sample variance ooops- now you discover that the data was actually from a population! so now you must give the population standard deviation.
Answers: 3
You know the right answer?
Photo Attached-
Here is a graph of the proportional relationship between calories and grams of fish...
Questions in other subjects:

Biology, 03.07.2020 08:01

Health, 03.07.2020 08:01


Mathematics, 03.07.2020 08:01
Mathematics, 03.07.2020 08:01


