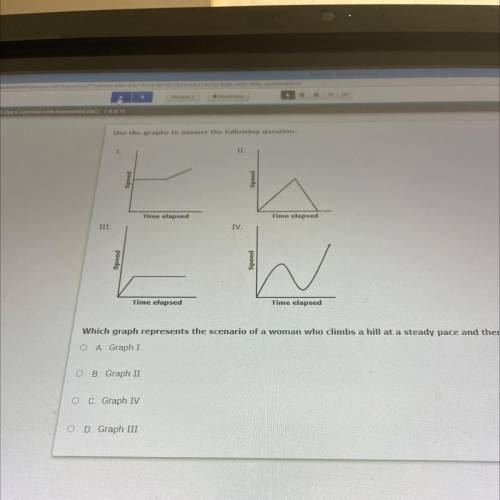
Use the graphs to answer the following question.
1.
Speed
Speed
Time elapsed
Time elapsed
III.
IV.
Speed
poods
Time elapsed
Time elapsed
Which graph represents the scenario of a woman who climbs a hill at a steady pace and then starts to run down the side?
A Graph I
OB Graph II
OC Graph IV
OD Graph III
Brent works part-time at a clothing store. he earns an hourly wage of $15. if he needs to earn more than $45 in a day and works for x hours a day, which inequality represents this situation? a. 15x > 45 b. 15x < 60 c. x > 60 d. 15x < 45 e. x < 60
Solving systems of linear equations: tables represent two linear functions in a systemöwhat is the solution to this system? 0 (10)0 (1.6)0 18,26)0 18-22)