
E
OV
<
Question 12/12
BOOKMARK
SUBMIT
The data given below shows t...

Mathematics, 09.02.2021 21:20 victory08
E
OV
<
Question 12/12
BOOKMARK
SUBMIT
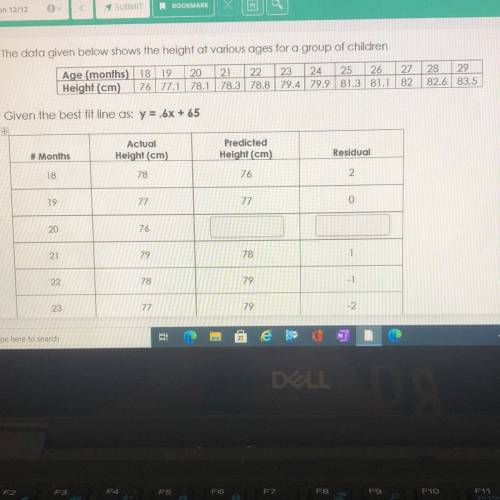
The data given below shows the height at various ages for a group of children
Age (months) 18 19 20 21 22 23 24 25 26 27 28 29
Height (cm) 76 77.1 78.1 78.3 78.8 79.4 79.9 81.3 81.1 82 82.6 83.5
Given the best fit line as: y = .6x + 65
Predicted
Height (cm)
Residual
Actual
Height (cm)
78
# Months
18
76
2
19
77
77
0
20
76
21
79
78
1
22
78
79
-1
23
77
79
-2
e

Answers: 2


Other questions on the subject: Mathematics
Mathematics, 22.06.2019 01:00, dyllanmasters99
Determine the intercepts of the line that passes through the following points. (15,-3)(15,−3) (20,-5)(20,−5) (25,-7)(25,−7)
Answers: 1
Mathematics, 22.06.2019 01:30, madisonnewby5021
Which shaded region is the solution to the system of inequalities? y y[tex]\geq[/tex]-x+1
Answers: 3
You know the right answer?
Questions in other subjects:
Mathematics, 21.08.2021 19:10

Social Studies, 21.08.2021 19:10
Mathematics, 21.08.2021 19:10


Business, 21.08.2021 19:10
Business, 21.08.2021 19:10
Business, 21.08.2021 19:10
Mathematics, 21.08.2021 19:10

Mathematics, 21.08.2021 19:10


