
Mathematics, 09.02.2021 19:40 jasmine12314
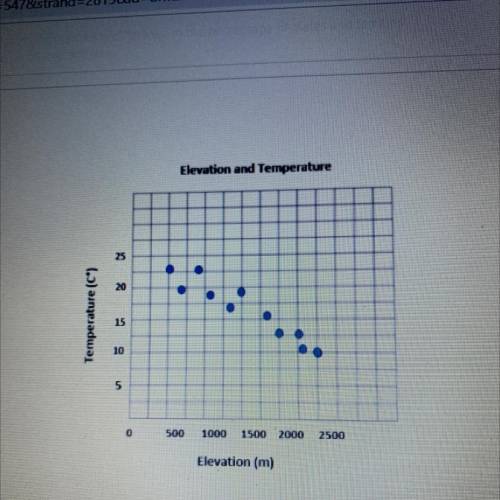
The scatter plot shows the relationship between elevation and temperature on a certain mountain peak in North America. Which statements are correct?
A. The data shows one potential outlier
B. The data shows a linear association
C. The data shows a clustering pattern
D. The data shows a negative association
E. As elevation increases, temperature decreases

Answers: 3


Other questions on the subject: Mathematics
Mathematics, 21.06.2019 21:30, allisonboggs85
Two airplanes start at the same place and travel in opposite directions, one at 395 miles per hour and the other at 422 miles per hour. how many hours will it take for the planes to be 2451 miles apart?
Answers: 1
Mathematics, 22.06.2019 00:30, dragpack70
Will mark ! (10 points also! ) if x varies inversely with y and x =6 when y= 10, find y when x=8 a. y=4.8 b. y=7.5 c. y=40/3 d. y=4/15
Answers: 1
Mathematics, 22.06.2019 05:20, asad92
The equation above shows how temperature f, measured in degrees fahrenheit, relates to a temperature c, measured in degrees celsius. based on the equation, which of the following must be true? a temperature increase of 1 degree fahrenheit is equivalent to a temperature increase of 5/9 degree celsius. a temperature increase of 1 degree celsius is equivalent to a temperature increase of 1.8 degrees fahrenheit. a temperature increase of 5/9 degree fahrenheit is equivalent to a temperature increase of 1 degree celsius. a) i only b) ii only c) iii only d) i and ii only
Answers: 1
You know the right answer?
The scatter plot shows the relationship between elevation and temperature on a certain mountain peak...
Questions in other subjects:


