subject
Mathematics, 09.02.2021 05:30 vanessa674

Previous 17
Next
Post Test: Ratios and Proportional Relationships
Submit Test
Reader Tools
0 Info
Save & Exit
17
Select the correct answer from the drop-down menu.
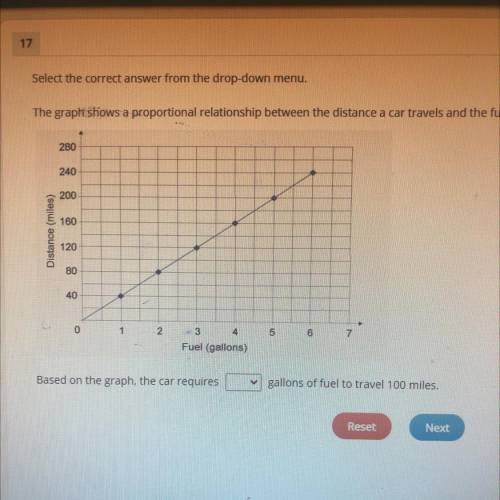
The graph shows a proportional relationship between the distance a car travels and the fuel it consumes.
.
280
240
200
5 180
Distance (miles)
120
80
40
0
1
2.
6
Fuel (gallons)
Based on the graph the car requires
✓ gallons of fuel to travel 100 miles.
Reset
Next


Previous

17
Next
Post Test: Ratios and Proportional Relationships
Submit Test
Reader Tools
0 Info

ansver
Answers: 3

Other questions on the subject: Mathematics

image
Mathematics, 21.06.2019 19:30, sweetbri7p5v6tn
Aline passes through 3,7 and 6,9 what equation represents the line
Answers: 2
image
Mathematics, 21.06.2019 20:00, songulakabulut1992
Maurice has 54 fewer comic books than rebecca. they have 130 comic books together .how many comic books are in maurices collection ? how many comic books are in rebeccas collection
Answers: 1
image
Mathematics, 21.06.2019 22:00, juhavyen
Determine the domain and range of the given function. the domain is all real numbers all real numbers greater than or equal to –2{x: x = –2, –1, 0, 1, 2}{y: y = –2, –1, 0, 1, 2}. the range is all real numbers all real numbers greater than or equal to –2{x: x = –2, –1, 0, 1, 2}{y: y = –2, –1, 0, 1, 2}.
Answers: 1
image
Mathematics, 21.06.2019 23:30, honwismun1127
Which statements are true about box plots? check all that apply. they describe sets of data. they include the mean. they show the data split into four parts. they show outliers through really short “whiskers.” each section of a box plot represents 25% of the data.
Answers: 3