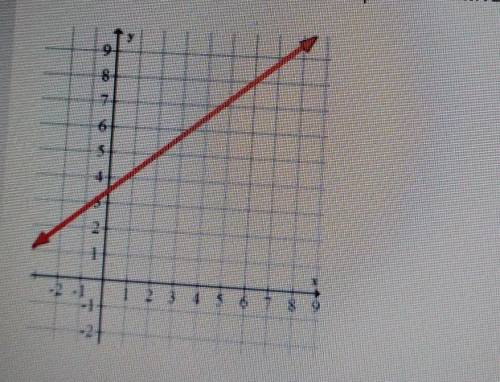
For the graph below, find the slope of the line. Write your answer as a decimal.
...

Mathematics, 09.02.2021 04:50 jessica6597
For the graph below, find the slope of the line. Write your answer as a decimal.

Answers: 2


Other questions on the subject: Mathematics
Mathematics, 21.06.2019 15:00, greekfreekisdbz
Use the graph to determine the range. which notations accurately represent the range? check all that apply. (–∞, 2) u (2, ∞) (–∞, –2) u (–2, ∞) {y|y ∈ r, y ≠ –2} {y|y ∈ r, y ≠ 2} y < 2 or y > 2 y < –2 or y > –2
Answers: 1
Mathematics, 21.06.2019 21:30, xxaurorabluexx
Use the method of cylindrical shells to find the volume v generated by rotating the region bounded by the curves about the given axis. y = 7ex, y = 7e^-x, x = 1; about the y-axis
Answers: 2
Mathematics, 21.06.2019 22:00, kiararoman1715
Aschool allots ? 1500 to spend on a trip to the theatre. theatre tickets have a regular cost of ? 55 each and are on offer for 1 5 off. a train ticket for the day will cost ? 12 each. if 2 teachers and the maximum number of students attend, how much money will the school have left over?
Answers: 2
You know the right answer?
Questions in other subjects:
Mathematics, 01.03.2021 21:50


Chemistry, 01.03.2021 21:50
Mathematics, 01.03.2021 21:50


