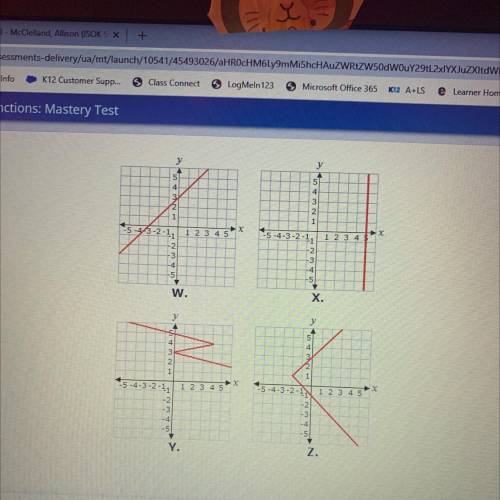
Which of these graphs represents a function?
A. W
B. X
C. Y
D. Z
...

Mathematics, 09.02.2021 04:00 xman839
Which of these graphs represents a function?
A. W
B. X
C. Y
D. Z

Answers: 3


Other questions on the subject: Mathematics
Mathematics, 21.06.2019 18:30, monyeemonyee12
Find the area of a parallelogram with base 15 yards and height 21 2/3
Answers: 1
Mathematics, 21.06.2019 19:30, leannamat2106
Which statements are true? check all that apply. the line x = 0 is perpendicular to the line y = –3. all lines that are parallel to the y-axis are vertical lines. all lines that are perpendicular to the x-axis have a slope of 0. the equation of the line parallel to the x-axis that passes through the point (2, –6) is x = 2. the equation of the line perpendicular to the y-axis that passes through the point (–5, 1) is y = 1.
Answers: 1
You know the right answer?
Questions in other subjects:

Biology, 18.07.2019 08:00

Physics, 18.07.2019 08:00

Mathematics, 18.07.2019 08:00

Mathematics, 18.07.2019 08:00
Physics, 18.07.2019 08:00


