
Mathematics, 08.02.2021 22:10 lovely8458
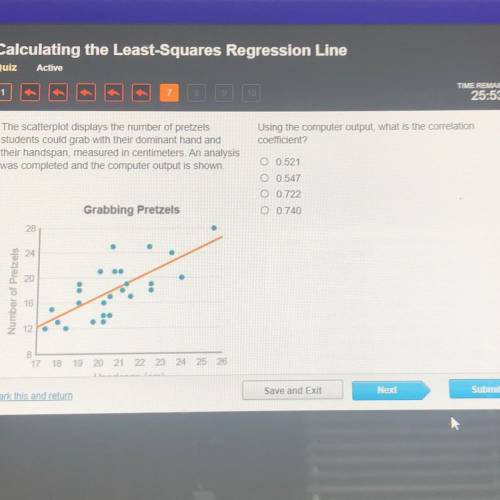
The scatterplot displays the number of pretzels
students could grab with their dominant hand and
their handspan, measured in centimeters. An analysis
was completed and the computer output is shown
Using the computer output, what is the correlation
coefficient?
00:521
0547
0.722
Grabbing Pretzels
0.740
28
24
.
20
Number of Pretzels
16
12

Answers: 2


Other questions on the subject: Mathematics
Mathematics, 22.06.2019 04:00, pizzacrust1633
A. 120 degrees b. 90 degrees c. 30 degrees d. 60 degrees
Answers: 1
Mathematics, 22.06.2019 04:00, jamiecoolgal8697
What is the answer to this equation? and if you can, find a way to show your work.
Answers: 2
You know the right answer?
The scatterplot displays the number of pretzels
students could grab with their dominant hand and
Questions in other subjects:


Chemistry, 26.02.2021 15:20
Mathematics, 26.02.2021 15:20
Mathematics, 26.02.2021 15:20


Computers and Technology, 26.02.2021 15:20


