
Mathematics, 08.02.2021 21:30 NijaNij
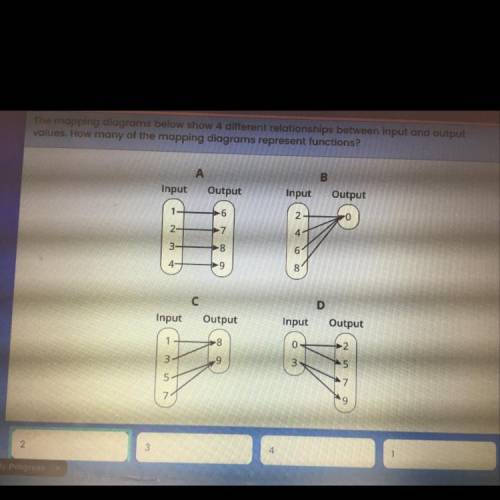
The mapping diagrams below show 4 different relationships between input and output
values. How many of the mapping diagrams represent functions?
А
Output
B
Output
Input
Input
1-
6
2
0
2-
7
4
3-
8
6
4-
9
8
с
D
Input
Output
Input
Output
8
0
3
9
3
5
5
7
9

Answers: 3


Other questions on the subject: Mathematics
Mathematics, 21.06.2019 12:30, MyAhBaBy123
Acar dealership pays you 5% commission on your first $10,000 on car sales and 8% commission on the sale amount over $10,000 if you sold a $12,000 car how much is your commission
Answers: 1
Mathematics, 21.06.2019 19:00, phelanpearson3995
The fraction 7/9 is equivalent to a percent that is greater than 100%. truefalse
Answers: 1
Mathematics, 21.06.2019 20:00, yesseniaroman21
Pepe and leo deposits money into their savings account at the end of the month the table shows the account balances. if there pattern of savings continue and neither earns interest nor withdraw any of the money , how will the balance compare after a very long time ?
Answers: 1
You know the right answer?
The mapping diagrams below show 4 different relationships between input and output
values. How many...
Questions in other subjects:


Mathematics, 14.08.2020 19:01


