
Mathematics, 08.02.2021 19:30 blink182lovgabbie
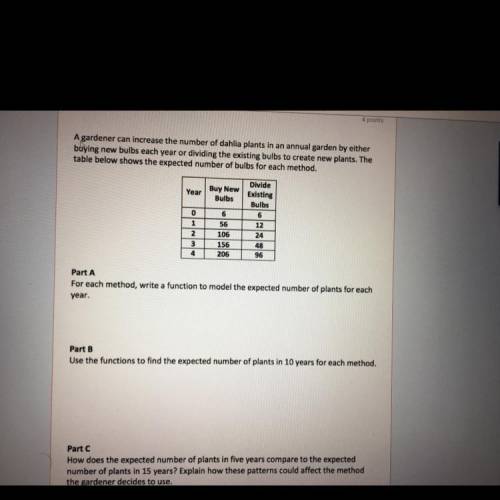
A gardener can increase the number of dahlia plants in an annual garden by either
buying new bulbs each year or dividing the existing bulbs to create new plants. The
table below shows the expected number of bulbs for each method.
Year Buy New
Bulbs
0
1
Divide
Existing
Bulbs
6
12
24
48
96
6
56
106
156
206
2
3
4
Part A
For each method, write a function to model the expected number of plants for each
year.
Part B
Use the functions to find the expected number of plants in 10 years for each method.

Answers: 2


Other questions on the subject: Mathematics
Mathematics, 21.06.2019 13:00, Trumpman137
If kn = 9 cm, mn = 21 cm, rs = 42 cm, and ps = 18 cm, what is the scale factor of figure klmn to figure pqrs?
Answers: 3
Mathematics, 21.06.2019 16:00, clarkster112679
1- identificar select the category that corresponds to each term. january 23 11: 59 pm unlimited attempts remaining grade settings 276-279 vocabulary list modelo fiesta quinceañera casada adolescencia viudo juventud navidad niñez vejez aniversario de bodas divorciado madurez cumpleaños soltera
Answers: 2
Mathematics, 21.06.2019 16:00, kell22wolf
Part one: measurements 1. measure your own height and arm span (from finger-tip to finger-tip) in inches. you will likely need some from a parent, guardian, or sibling to get accurate measurements. record your measurements on the "data record" document. use the "data record" to you complete part two of this project. name relationship to student x height in inches y arm span in inches archie dad 72 72 ginelle mom 65 66 sarah sister 64 65 meleah sister 66 3/4 67 rachel sister 53 1/2 53 emily auntie 66 1/2 66 hannah myself 66 1/2 69 part two: representation of data with plots 1. using graphing software of your choice, create a scatter plot of your data. predict the line of best fit, and sketch it on your graph. part three: the line of best fit include your scatter plot and the answers to the following questions in your word processing document 1. 1. which variable did you plot on the x-axis, and which variable did you plot on the y-axis? explain why you assigned the variables in that way. 2. write the equation of the line of best fit using the slope-intercept formula $y = mx + b$. show all your work, including the points used to determine the slope and how the equation was determined. 3. what does the slope of the line represent within the context of your graph? what does the y-intercept represent? 5. use the line of best fit to you to describe the data correlation.
Answers: 2
You know the right answer?
A gardener can increase the number of dahlia plants in an annual garden by either
buying new bulbs...
Questions in other subjects:


