 (-1 x -1) - 2x ( 2 times -1) + 1
Help please !!
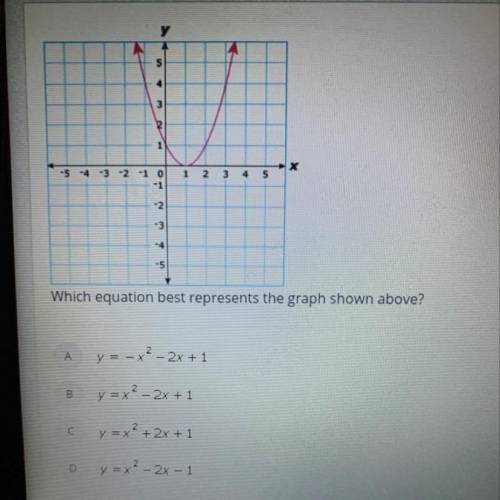
Which equation best represents the graph shown above?
...

Mathematics, 06.02.2021 05:40 chynaroyal19
Help please !!
Which equation best represents the graph shown above?

Answers: 2


Other questions on the subject: Mathematics
Mathematics, 21.06.2019 12:30, vanessam16
Listed below are the measured radiation absorption rates? (in w/kg) corresponding to 11 cell phones. use the given data to construct a no plot and identify the 5- number summary
Answers: 2
Mathematics, 21.06.2019 22:30, brookerebman15
Find solution of the linear equation y = 2/3x + 1/3
Answers: 2
Mathematics, 22.06.2019 02:00, fespinoza019
The null and alternate hypotheses are: h0: μ1 ≤ μ2 h1: μ1 > μ2 a random sample of 22 items from the first population showed a mean of 113 and a standard deviation of 12. a sample of 16 items for the second population showed a mean of 99 and a standard deviation of 6. use the 0.01 significant level. find the degrees of freedom for unequal variance test. (round down your answer to the nearest whole number.) state the decision rule for 0.010 significance level. (round your answer to 3 decimal places.) compute the value of the test statistic. (round your answer to 3 decimal places.) what is your decision regarding the null hypothesis? use the 0.01 significance level.
Answers: 1
You know the right answer?
Questions in other subjects:
Mathematics, 23.08.2019 20:00
Mathematics, 23.08.2019 20:00

History, 23.08.2019 20:00
History, 23.08.2019 20:00

Biology, 23.08.2019 20:00


