
Mathematics, 06.02.2021 01:00 lagarde
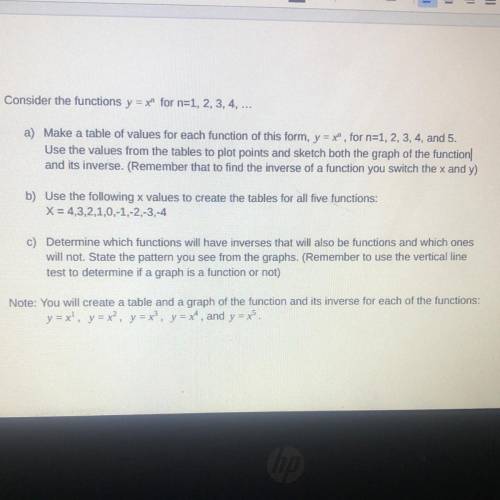
Consider the functions y = x" for n=1, 2, 3, 4, ...
a) Make a table of values for each function of this form, y = x" , for n=1, 2, 3, 4, and 5.
Use the values from the tables to plot points and sketch both the graph of the function
and its inverse. (Remember that to find the inverse of a function you switch the x and y)
b) Use the following x values to create the tables for all five functions:
X = 4,3,2,1,0,-1,-2,-3,-4
c) Determine which functions will have inverses that will also be functions and which ones
will not. State the pattern you see from the graphs. (Remember to use the vertical line
test to determine if a graph is a function or not)
Note: You will create a table and a graph of the function and its inverse for each of the functions:
y = xl, y = x, y = x3, y = xº, and y = x.
Do I have to create 9 tables for y=x^#?

Answers: 2


Other questions on the subject: Mathematics
Mathematics, 21.06.2019 20:30, avahrider1
The distance of a chord from the centre of a circle is 12cm and the lenght of the chord is 10cm. find the radius of the circle
Answers: 1
Mathematics, 21.06.2019 21:00, CoolDudeTrist
Construct the graph that models the given situation
Answers: 1
Mathematics, 21.06.2019 22:00, taliyahjhonson1
The birth weights of newborn babies in the unites states follow in a normal distrubution with a mean of 3.4 kg and standard deviation of 0.6 kg. reaserches interested in studying how. children gain weights decide to take random samples of 100 newborn babies and calculate the sample mean birth weights for each sample
Answers: 1
You know the right answer?
Consider the functions y = x" for n=1, 2, 3, 4, ...
a) Make a table of values for each function of...
Questions in other subjects:

Social Studies, 02.06.2021 18:20
Mathematics, 02.06.2021 18:20

Health, 02.06.2021 18:20
Mathematics, 02.06.2021 18:20


Mathematics, 02.06.2021 18:20


