Mathematics, 06.02.2021 01:00 IsoSaysHi
Which graph represents the parametric equations x(t) = t – 4 and y(t) = t2 + 5 for –1 ≤ t ≤ 2?

Answers: 3


Other questions on the subject: Mathematics

Mathematics, 21.06.2019 17:20, mqturner1989Kedie
Select a graph that have an equation with a < 0
Answers: 2

Mathematics, 21.06.2019 21:40, carson5238
If angle b measures 25°, what is the approximate perimeter of the triangle below? 10.3 units 11.8 units 22.1 units 25.2 units
Answers: 2

Mathematics, 21.06.2019 22:00, dolphinkina35
Using inductive reasoning, what are the next two number in this set? 2,3/2,4/3,5/4,
Answers: 1

Mathematics, 21.06.2019 22:10, Jenifermorales101
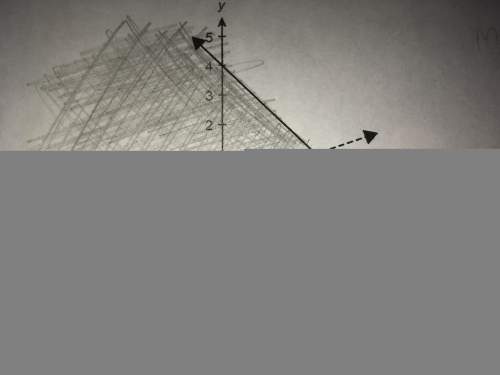
Write the function for the graph. (1.8) (0,4)
Answers: 3
You know the right answer?
Which graph represents the parametric equations x(t) = t – 4 and y(t) = t2 + 5 for –1 ≤ t ≤ 2?...
Questions in other subjects:


Mathematics, 28.04.2021 18:00

Mathematics, 28.04.2021 18:10

Business, 28.04.2021 18:10

Mathematics, 28.04.2021 18:10

History, 28.04.2021 18:10


Mathematics, 28.04.2021 18:10

Mathematics, 28.04.2021 18:10


