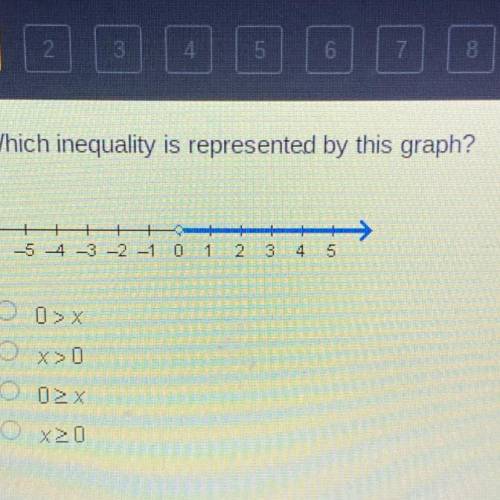
Which inequality is represented by this graph?
A. 0>x
B. x>0
C. 0>_x
D....

Mathematics, 05.02.2021 22:40 jlarmee9
Which inequality is represented by this graph?
A. 0>x
B. x>0
C. 0>_x
D. x>_0

Answers: 2


Other questions on the subject: Mathematics
Mathematics, 21.06.2019 18:10, jaimejohnston2
What is the ratio for the surface areas of the cones shown below, given that they are similar and that the ratio of their radil and altitudes is 4: 3? 23
Answers: 1
Mathematics, 21.06.2019 23:30, jadenweisman1
The approximate line of best fit for the given data points, y = −2x − 2, is shown on the graph. which is the residual value when x = –2? a)–2 b)–1 c)1 d)2
Answers: 2
You know the right answer?
Questions in other subjects:

Mathematics, 15.01.2021 22:00

English, 15.01.2021 22:00

Business, 15.01.2021 22:00
Mathematics, 15.01.2021 22:00
English, 15.01.2021 22:00
History, 15.01.2021 22:00
History, 15.01.2021 22:00


