
Mathematics, 05.02.2021 21:10 katy1110
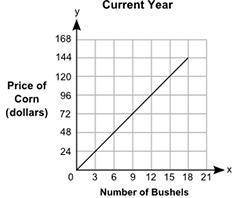
The graph shows the prices of different numbers of bushels of corn at a store in the current year. The table shows the prices of different numbers of bushels of corn at the same store in the previous year.
A graph shows Number of Bushels on x-axis and Price of Corn in dollars on y-axis. The x-axis scale is shown from 0 to 21 at increments of 3, and the y-axis scale is shown from 0 to 168 at increments of 24. A straight line joins the ordered pairs 3, 24 and 6, 48 and 9, 72 and 12, 96 and 15, 120 and 18, 144.
Previous Year
Number of Bushels Price of Corn (dollars)
3 21
6 42
9 63
12 84
Part A: Describe in words how you can find the rate of change of a bushel of corn in the current year, and find the value. (5 points)
Part B: How many dollars more is the price of a bushel of corn in the current year than the price of a bushel of corn in the previous year? Show your work. (5 points)

Answers: 3


Other questions on the subject: Mathematics
Mathematics, 21.06.2019 15:30, hejdiidid9311
Will used 20 colored tiles to make a design in art class. 5/20 of his tiles were red. what is an equivalent fraction for the red tiles?
Answers: 1
Mathematics, 21.06.2019 22:50, zitterkoph
Listed below are time intervals (min) between eruptions of a geyser. assume that the "recent" times are within the past few years, the "past" times are from around 20 years ago, and that the two samples are independent simple random samples selected from normally distributed populations. do not assume that the population standard deviations are equal. does it appear that the mean time interval has changed? is the conclusion affected by whether the significance level is 0.10 or 0.01? recent 78 90 90 79 57 101 62 87 71 87 81 84 57 80 74 103 62 past 88 89 93 94 65 85 85 92 87 91 89 91 follow the steps of hypothesis testing, including identifying the alternative and null hypothesis, calculating the test statistic, finding the p-value, and making a conclusions about the null hypothesis and a final conclusion that addresses the original claim. use a significance level of 0.10. is the conclusion affected by whether the significance level is 0.10 or 0.01? answer choices below: a) yes, the conclusion is affected by the significance level because h0 is rejected when the significance level is 0.01 but is not rejected when the significance level is 0.10. b) no, the conclusion is not affected by the significance level because h0 is not rejected regardless of whether a significance level of 0.10 or 0.01 is used. c) yes, the conclusion is affected by the significance level because h0 is rejected when the significance level is 0.10 but is not rejected when the significance level is 0.01. d) no, the conclusion is not affected by the significance level because h0 is rejected regardless of whether a significance level of 0.10 or 0.01 is used.
Answers: 3
You know the right answer?
The graph shows the prices of different numbers of bushels of corn at a store in the current year. T...
Questions in other subjects:
Mathematics, 27.01.2020 08:31
Mathematics, 27.01.2020 08:31

Mathematics, 27.01.2020 08:31
Mathematics, 27.01.2020 08:31
Social Studies, 27.01.2020 08:31
Mathematics, 27.01.2020 08:31
Mathematics, 27.01.2020 08:31


