
Mathematics, 05.02.2021 17:10 CarlosCooke2
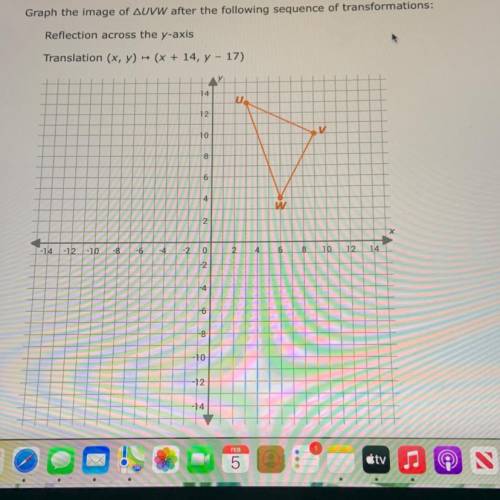
Graph the image of UVW after the following sequence of transformations: Reflection across the y-axis. Translation (x, y) — (x+14, y-17) Please help!

Answers: 3


Other questions on the subject: Mathematics
Mathematics, 21.06.2019 20:30, kuddlebugsmommy
Martha has a deck of cards. she has lost some of the cards, and now the deck only contains nine spades, eleven diamonds, eight clubs, and twelve hearts. martha predicts that whenever she draws a card from the deck without looking, she will draw a club one-fifth of the time. which activity would best allow martha to test her prediction? a. randomly draw a card from the box and see if it is a club. b. randomly draw a card. then, continue to draw another card until all eight clubs are drawn. c. randomly draw and replace a card 120 times. then, observe how close to 30 times a club is drawn. d. randomly draw and replace a card 100 times. then, observe how close to 20 times a club is drawn.
Answers: 1
Mathematics, 21.06.2019 23:30, haybaby312oxdjli
Line u passes through points (-52, -18) and (-29, 53). line v passes through points (90, 33) and (19, 56). are line u and line v parallel or perpendicular?
Answers: 1
Mathematics, 22.06.2019 00:00, ShortCakes02
Rewrite the equation x = 65 - 60p by factoring the side that contains the variable p.
Answers: 2
Mathematics, 22.06.2019 03:00, ariano76
A. find the power of the test, when the null hypothesis assumes a population mean of mu = 450, with a population standard deviation of 156, the sample size is 5 and the true mean is 638.47 with confidence intervals of 95 b. find the power of the test, when the null hypothesis assumes a population mean of mu = 644, with a population standard deviation of 174, the sample size is 3 and the true mean is 744.04 with confidence intervals of 95% c. find the power of the test, when the null hypothesis assumes a population mean of mu = 510, with a population standard deviation of 126, the sample size is 10 and the true mean is 529.44 with confidence intervals of 95
Answers: 2
You know the right answer?
Graph the image of UVW after the following sequence of transformations: Reflection across the y-axis...
Questions in other subjects:

English, 26.10.2021 23:50

History, 26.10.2021 23:50


Geography, 26.10.2021 23:50
Mathematics, 26.10.2021 23:50


