
Mathematics, 04.02.2021 22:50 deboerzac4809
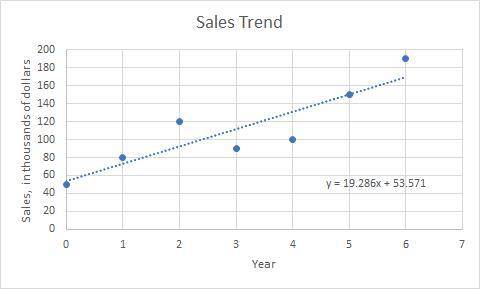
Suppose Year 0 = 2010 1) What is the slope of this trendline? Explain the significance of the slope in the context of the model. 2) What is the y-intercept of this trendline? Explain the significance of the y-intercept in the context of the model. 3) Predict what the outcome will be 50 years from now. Is making a prediction 50 years into the future appropriate? Why or why not?

Answers: 2


Other questions on the subject: Mathematics
Mathematics, 21.06.2019 20:00, faithyholcomb
Someone answer asap for ! max recorded the heights of 500 male humans. he found that the heights were normally distributed around a mean of 177 centimeters. which statements about max’s data must be true? a. the median of max’s data is 250 b. more than half of the data points max recorded were 177 centimeters. c. a data point chosen at random is as likely to be above the mean as it is to be below the mean. d. every height within three standard deviations of the mean is equally likely to be chosen if a data point is selected at random.
Answers: 1
Mathematics, 21.06.2019 21:00, arizmendiivan713
*let m∠cob = 50°30’, m∠aob = 70° and m∠aoc = 20°30’. could point c be in the interior of ∠aob? why?
Answers: 1
Mathematics, 21.06.2019 22:20, abbygriffin8575
Which graph has figures that can undergo a similarity transformation to justify that they are similar? (obviously not the third one)
Answers: 2
You know the right answer?
Suppose Year 0 = 2010
1) What is the slope of this trendline? Explain the significance of the slope...
Questions in other subjects:

English, 20.02.2020 09:28

Mathematics, 20.02.2020 09:28
Mathematics, 20.02.2020 09:28
Mathematics, 20.02.2020 09:29


