
Mathematics, 04.02.2021 20:10 evelyngarcia99
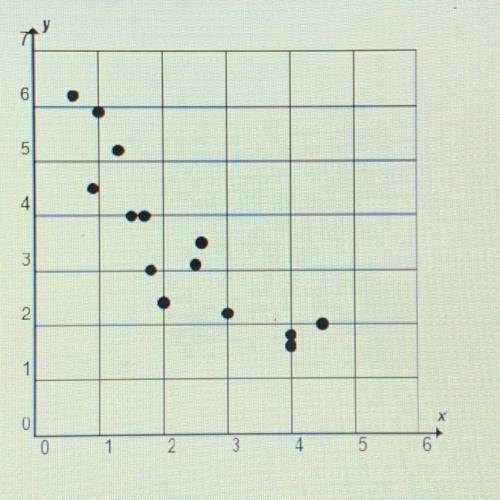
Which describes the correlation shown in the scatterplot?
A. There is a positive correlation in the data set.
B. There is a negative correlation in the data set.
C. This is no correlation in the data set.
D. More points are needed to determine the correlation.

Answers: 3


Other questions on the subject: Mathematics
Mathematics, 21.06.2019 20:40, eddyjunior679
What is the probability of throwing several dice with sum equal to 6 (six)? show the ways of possibilities for sum 6 (as the numerator) and the ways of throwing n dices for n = 1, 2, 3, 4 or 5 as denominator for all the questions to earn full credits. (a)throw one die, (b) throw two dice, (c) throw three dice (d) throw 4 dice, (e) throw 5 dice
Answers: 3
Mathematics, 21.06.2019 21:30, paolacorazza
Miss henderson wants to build a fence around a rectangular garden in her backyard in the scale drawing the perimeter of the garden is 14 in of the actual length of a b is 20 ft how many feet of fencing what you need
Answers: 3
You know the right answer?
Which describes the correlation shown in the scatterplot?
A. There is a positive correlation in the...
Questions in other subjects:


Physics, 04.12.2020 09:30
Mathematics, 04.12.2020 09:40

Mathematics, 04.12.2020 09:40
Mathematics, 04.12.2020 09:40

Chemistry, 04.12.2020 09:40
Physics, 04.12.2020 09:40


