
Mathematics, 01.01.2020 18:31 Yskdl
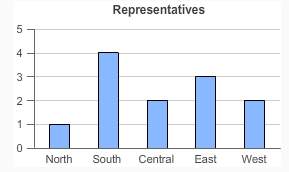
The bar graph shows the number of representatives from the north, south, central, east and west regions of a city
according to the bar graph what is the experimental probability that a randomly chosen representative is from the west region?
a)1/6
b)1/12
c)1/5
d)1/3

Answers: 2


Other questions on the subject: Mathematics
Mathematics, 21.06.2019 16:30, VgCarlos2596
What are “like terms”? why can we only add like terms?
Answers: 1
Mathematics, 21.06.2019 22:00, breannaasmith1122
Mr. walker is looking at the fundraiser totals for the last five years , how does the mean of the totals compare to the median?
Answers: 1
You know the right answer?
The bar graph shows the number of representatives from the north, south, central, east and west regi...
Questions in other subjects:


