
Mathematics, 04.02.2021 16:10 bookworm43
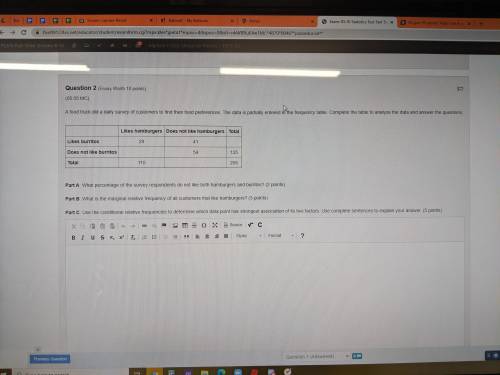
A food truck did a daily survey of customers to find their food preferences. The data is partially entered in the frequency table. Complete the table to analyze the data and answer the questions:
Likes hamburgers Does not like hamburgers Total
Likes burritos 29 41
Does not like burritos 54 135
Total 110 205
Part A: What percentage of the survey respondents do not like both hamburgers and burritos? (2 points)
Part B: What is the marginal relative frequency of all customers that like hamburgers? (3 points)
Part C: Use the conditional relative frequencies to determine which data point has strongest association of its two factors. Use complete sentences to explain your answer. (5 points)

Answers: 1


Other questions on the subject: Mathematics
Mathematics, 21.06.2019 19:20, solobiancaa
Which of the following quartic functions has x = –1 and x = –2 as its only two real zeroes?
Answers: 1
Mathematics, 22.06.2019 01:30, isabellecannuli
Which equation represents a line that passes through the point (9, -4) and has a slope of 3/5?
Answers: 1
You know the right answer?
A food truck did a daily survey of customers to find their food preferences. The data is partially e...
Questions in other subjects:


Mathematics, 18.03.2021 03:00
Mathematics, 18.03.2021 03:00
Mathematics, 18.03.2021 03:00
Mathematics, 18.03.2021 03:00

Geography, 18.03.2021 03:00
Mathematics, 18.03.2021 03:00


