
Mathematics, 04.02.2021 16:20 Alan0201
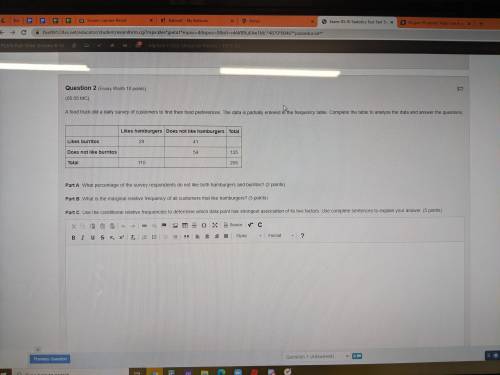
A food truck did a daily survey of customers to find their food preferences. The data is partially entered in the frequency table. Complete the table to analyze the data and answer the questions:
Likes hamburgers Does not like hamburgers Total
Likes burritos 29 41
Does not like burritos 54 135
Total 110 205
Part A: What percentage of the survey respondents do not like both hamburgers and burritos? (2 points)
Part B: What is the marginal relative frequency of all customers that like hamburgers? (3 points)
Part C: Use the conditional relative frequencies to determine which data point has strongest association of its two factors. Use complete sentences to explain your answer. (5 points)

Answers: 3


Other questions on the subject: Mathematics
Mathematics, 21.06.2019 13:40, kkeith121p6ujlt
Questions 14 through 23, choose the onest answer. write your answer in the box forestion 24. mark your answer on the coordinatene grid for question 25.the sum of three consecutive even numbers is 96.what is the largest of these numbers? (a) 30(b) 32(c) 34(d) 36
Answers: 2
Mathematics, 21.06.2019 16:30, taythestargazer71
What is the name used to describe a graph where for some value of x, there exists 2 or more different values of y?
Answers: 2
Mathematics, 21.06.2019 17:40, cifjdhhfdu
Aregular hexagon has sides of 2 feet. what is the area of the hexagon? 12 ft2 12 ft2 24 ft2 6 ft2
Answers: 2
You know the right answer?
A food truck did a daily survey of customers to find their food preferences. The data is partially e...
Questions in other subjects:

History, 02.02.2021 07:20
Mathematics, 02.02.2021 07:20


History, 02.02.2021 07:20
History, 02.02.2021 07:20

Biology, 02.02.2021 07:20

Advanced Placement (AP), 02.02.2021 07:20


