
Mathematics, 04.02.2021 16:10 glendaward8233
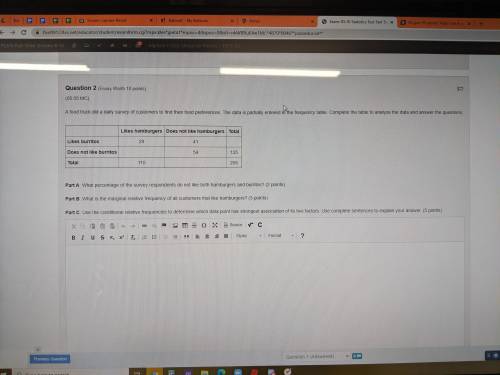
A food truck did a daily survey of customers to find their food preferences. The data is partially entered in the frequency table. Complete the table to analyze the data and answer the questions:
Likes hamburgers Does not like hamburgers Total
Likes burritos 29 41
Does not like burritos 54 135
Total 110 205
Part A: What percentage of the survey respondents do not like both hamburgers and burritos? (2 points)
Part B: What is the marginal relative frequency of all customers that like hamburgers? (3 points)
Part C: Use the conditional relative frequencies to determine which data point has strongest association of its two factors. Use complete sentences to explain your answer. (5 points)

Answers: 3


Other questions on the subject: Mathematics
Mathematics, 21.06.2019 18:30, starlightmoon213
The measure of one angle of an octagon is two times smaller that of the other seven angles. what is the measure of each angle?
Answers: 3
Mathematics, 21.06.2019 19:30, monnicawilliam
In the geometric progression –3, 12, −48… what term is 3,072?
Answers: 2
Mathematics, 22.06.2019 00:10, chloeholt123
What 8/12+8/11 in another way than and improper fraction
Answers: 2
You know the right answer?
A food truck did a daily survey of customers to find their food preferences. The data is partially e...
Questions in other subjects:
Mathematics, 12.03.2021 20:10

Mathematics, 12.03.2021 20:10

Chemistry, 12.03.2021 20:10


Social Studies, 12.03.2021 20:10
Mathematics, 12.03.2021 20:10


