
Mathematics, 04.02.2021 16:10 rosyarellano101127
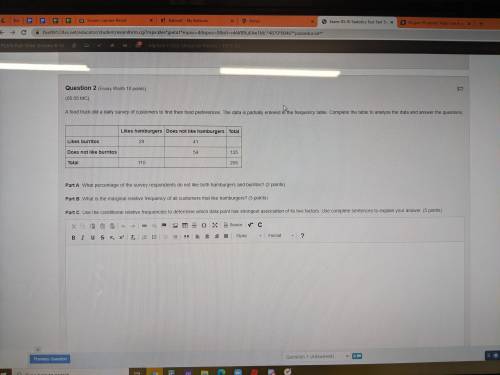
HELP A food truck did a daily survey of customers to find their food preferences. The data is partially entered in the frequency table. Complete the table to analyze the data and answer the questions:
Likes hamburgers Does not like hamburgers Total
Likes burritos 29 41
Does not like burritos 54 135
Total 110 205
Part A: What percentage of the survey respondents do not like both hamburgers and burritos? (2 points)
Part B: What is the marginal relative frequency of all customers that like hamburgers? (3 points)
Part C: Use the conditional relative frequencies to determine which data point has strongest association of its two factors. Use complete sentences to explain your answer. (5 points)

Answers: 2


Other questions on the subject: Mathematics
Mathematics, 21.06.2019 19:30, raytaygirl
Lin is writing an equation to model the proportional relationship between y, the total cost in dollars of downloading videos from a website, and x, the number of videos downloaded. she knows that the total cost to download 3 videos was $12. her work to find the equation is shown below. joylin’s work step 1 k= 3/12= 0.25 step 2 y= 0.25x where did joylin make her first error?
Answers: 2
Mathematics, 21.06.2019 20:00, lavorisjonesjr1
Worth 30 points! in this diagram, both polygons are regular. what is the value, in degrees, of the sum of the measures of angles abc and abd?
Answers: 2
Mathematics, 21.06.2019 20:30, allimaycatp8qgaq
Secant ac and bd intersect at point e inside f what is the measure of aed if measurements cd equals 30 a b is 50 and cb is 170
Answers: 1
Mathematics, 22.06.2019 01:30, Laners0219
Which represents the number of times all outcomes less than a given outcome occur? cumulative frequency relative frequency frequency cumulative relative frequency
Answers: 3
You know the right answer?
HELP A food truck did a daily survey of customers to find their food preferences. The data is partia...
Questions in other subjects:


Mathematics, 12.08.2020 06:01


