
Mathematics, 04.02.2021 06:30 2alshawe201
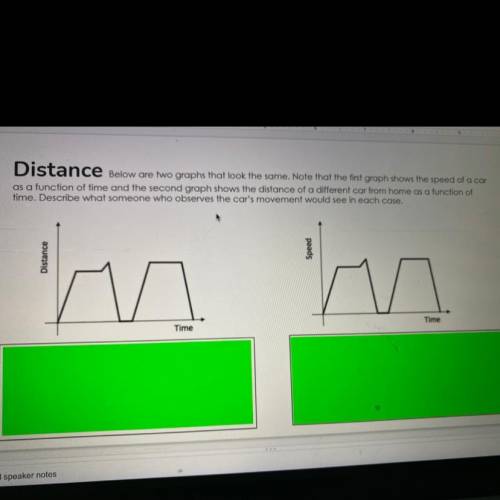
Below are two graphs that look the same. Note that the first graph shows the speed of a car
as a function of time and the second graph shows the distance of a different car from home as a function of
time. Describe what someone who observes the car's movement would see in each case.

Answers: 3


Other questions on the subject: Mathematics
Mathematics, 22.06.2019 01:30, Jadaflournoy5
Pls math have no ideamultiply and simppify. 2x^2y^3z^2 • 4xy^4x^2
Answers: 2
Mathematics, 22.06.2019 06:00, gebradshaw2005
Which inequality represents all the values of x for which the quotient below is defined? √x+1 ÷ √ 4-x
Answers: 3
You know the right answer?
Below are two graphs that look the same. Note that the first graph shows the speed of a car
as a fu...
Questions in other subjects:

Biology, 08.10.2019 08:30
Mathematics, 08.10.2019 08:30

Chemistry, 08.10.2019 08:30
Biology, 08.10.2019 08:30
Mathematics, 08.10.2019 08:30
Mathematics, 08.10.2019 08:30

Health, 08.10.2019 08:30


