Question 3 of 10
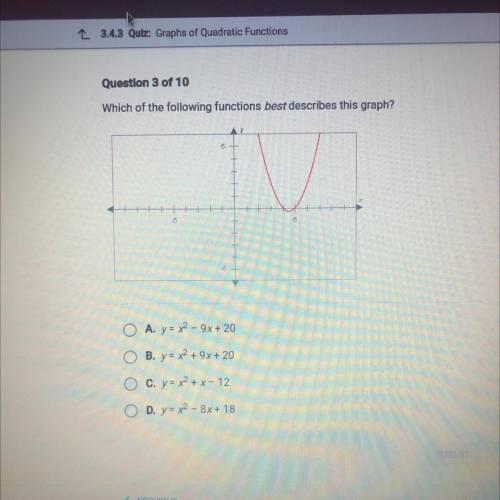
Which of the following functions best describes this graph?
6
-5
...

Mathematics, 04.02.2021 04:40 sullivanjakob
Question 3 of 10
Which of the following functions best describes this graph?
6
-5
O A. y=x2-9x+ 20
O B. y = x2 + 9x+ 20
O C. y= x2 + x - 12
O D. y= x2 - 8x+18

Answers: 3


Other questions on the subject: Mathematics
Mathematics, 21.06.2019 16:00, nathanb29oue8gj
Aheated piece of metal cools according to the function c(x) = (.5)x ? 7, where x is measured in hours. a device is added that aids in cooling according to the function h(x) = ? x ? 2. what will be the temperature of the metal after two hours?
Answers: 2
You know the right answer?
Questions in other subjects:
Mathematics, 30.07.2021 21:20
Mathematics, 30.07.2021 21:20
Mathematics, 30.07.2021 21:20

Computers and Technology, 30.07.2021 21:20
Mathematics, 30.07.2021 21:20
Mathematics, 30.07.2021 21:20

Geography, 30.07.2021 21:20
Mathematics, 30.07.2021 21:30


