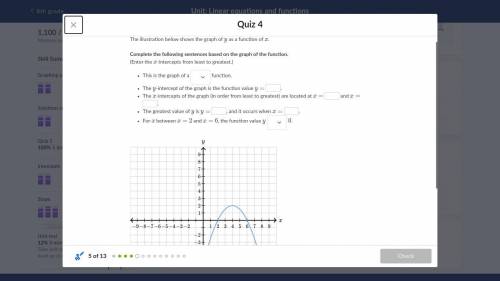
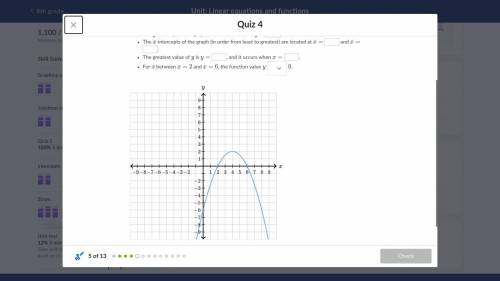
The illustration below shows the graph of yyy as a function of xxx.
Complete the following sen...

Mathematics, 04.02.2021 02:50 kandikisses5594
The illustration below shows the graph of yyy as a function of xxx.
Complete the following sentences based on the graph of the function.
(Enter the xxx-intercepts from least to greatest.)
This is the graph of a
function.
The yyy-intercept of the graph is the function value y=\:y=y, equals
.
The xxx-intercepts of the graph (in order from least to greatest) are located at x=\:x=x, equals
and x=\:x=x, equals
.
The greatest value of yyy is y=\:y=y, equals
, and it occurs when x=\:x=x, equals
.
For xxx between x=2x=2x, equals, 2 and x=6x=6x, equals, 6, the function value y\:yy
\:000.

Answers: 3


Other questions on the subject: Mathematics
Mathematics, 21.06.2019 22:20, skyhighozzie
(b) suppose that consolidated power decides to use a level of significance of α = .05, and suppose a random sample of 100 temperature readings is obtained. if the sample mean of the 100 temperature readings is x⎯⎯ = 60.990, test h0 versus ha and determine whether the power plant should be shut down and the cooling system repaired. perform the hypothesis test by using a critical value and a p-value. assume σ = 5. (round your z to 2 decimal places and p-value to 4 decimal places.)
Answers: 2
Mathematics, 21.06.2019 22:30, minnahelhoor
How do i find the missing angle measure in a polygon
Answers: 1
You know the right answer?
Questions in other subjects:

History, 20.10.2020 20:01


Spanish, 20.10.2020 20:01
Mathematics, 20.10.2020 20:01


