
Mathematics, 04.02.2021 01:00 lilloser
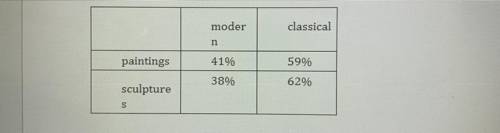
The relative frequency table shows the percentage of each type of art (painting or
sculpture) in a museum that would classify in the different styles (modern or
classical). Based on these percentages, is there evidence to suggest an association between the variables? Explain your reasoning.

Answers: 2


Other questions on the subject: Mathematics
Mathematics, 21.06.2019 19:00, megkate
1. writing an equation for an exponential function by 2. a piece of paper that is 0.6 millimeter thick is folded. write an equation for the thickness t of the paper in millimeters as a function of the number n of folds. the equation is t(n)= 3. enter an equation for the function that includes the points. (-2, 2/5) and (-1,2)
Answers: 1
Mathematics, 21.06.2019 19:20, SmolBeanPotato
Aefg - almn. find the ratio of aefg to almn. a)1: 4 b)1: 2 c)2.1 d)4: 1
Answers: 1
Mathematics, 21.06.2019 19:30, Animallover100
Write the sine and cosine values of a, b, respectively, in the figure for (1) and (2) + explanation.
Answers: 1
You know the right answer?
The relative frequency table shows the percentage of each type of art (painting or
sculpture) in a...
Questions in other subjects:
Mathematics, 17.08.2021 14:00

English, 17.08.2021 14:00

Social Studies, 17.08.2021 14:00
Mathematics, 17.08.2021 14:00
Mathematics, 17.08.2021 14:00

History, 17.08.2021 14:00
Social Studies, 17.08.2021 14:00
English, 17.08.2021 14:00
Mathematics, 17.08.2021 14:00
Mathematics, 17.08.2021 14:00


