
Mathematics, 03.02.2021 21:40 zanaplen27
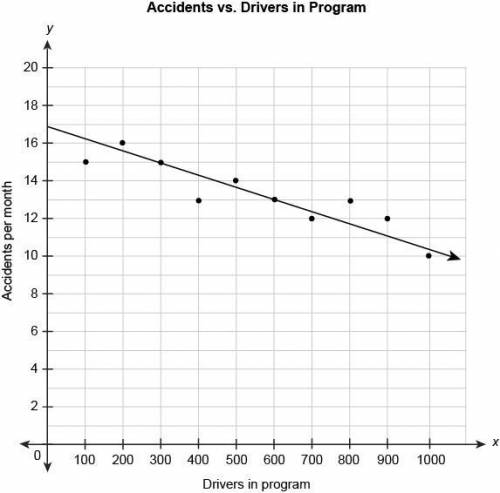
The scatter plot shows the relationship between the number of car accidents in a month and the number of drivers attending a program on distracted driving. The equation represents the linear model for this data.
y=−0.0067x+17
What does the number -0.0067 in the equation mean in this context?
The number of accidents was reduced by 0.67 per month every month.
The number of accidents was reduced by 0.67 per month for every additional driver in the program.
The number of accidents increased by 0.67 per month for every additional 100 drivers in the program.
The number of accidents was reduced by 0.67 per month for every additional 100 drivers in the program.
There were 0.67 accidents per month. The scatter plot shows the relationship between the number of car accidents in a month and the number of drivers attending a program on distracted driving. The equation represents the linear model for this data.

Answers: 2


Other questions on the subject: Mathematics
Mathematics, 21.06.2019 14:00, chriscol4082
Aportion of a line bounded by two points is defined as
Answers: 1
Mathematics, 21.06.2019 23:30, blueval3tine
Sally deposited money into a savings account paying 4% simple interest per year. the first year, she earn $75 in interest. how much interest will she earn during the following year?
Answers: 1
You know the right answer?
The scatter plot shows the relationship between the number of car accidents in a month and the numbe...
Questions in other subjects:


Geography, 26.01.2021 20:20


Mathematics, 26.01.2021 20:20


