
Mathematics, 03.02.2021 21:00 epunisa
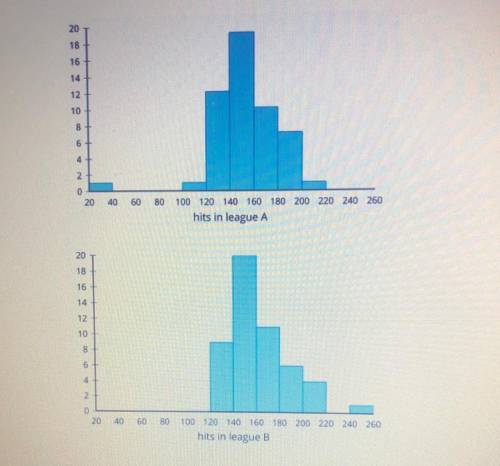
The histograms and summary statistics summarize the data for the number of hits in the season by baseball players in two leagues. Use the shape of the distributions to select the appropriate measures of center and variability for the number of hits by players in each of the two leagues. Compare the number of hits by players in the two leagues using these measures. Explain what each value means in your comparison.
Some summary statistics for the number of hits by players in each league.
mean
151.12
163.25
median
148
157
standard deviation
26.83
24.93
minimum
29
136
Q1
136
145
Q3
167
178
league A
league B
maximum
207
256

Answers: 1


Other questions on the subject: Mathematics
Mathematics, 21.06.2019 16:00, kathyc53
Areal estate agent earns $32,000 a year plus $1,000 for each apartment he sells. write an equation that shows the relationship between the number of apartments abe sells, n, and the total amount he earns in a year, e. what is the total amount abe would earn from selling 10 apartments in one year
Answers: 3
Mathematics, 21.06.2019 19:30, danielahchf
Ineed with angles and the measure of them i have abc a is 65 and b is (3x-10) and c is (2x) find the value of x
Answers: 2
Mathematics, 22.06.2019 01:50, Savageman9509
The length of time it takes to find a parking space at 9 a. m. follows a normal distribution with a mean of 5 minutes and a standard deviation of 2 minutes. find the probability that it takes at least 8 minutes to find a parking space. (round your answer to four decimal places.)
Answers: 1
You know the right answer?
The histograms and summary statistics summarize the data for the number of hits in the season by bas...
Questions in other subjects:

History, 31.01.2020 21:01
Mathematics, 31.01.2020 21:01

Social Studies, 31.01.2020 21:01


Geography, 31.01.2020 21:01


