
Mathematics, 03.02.2021 02:50 LizaB15
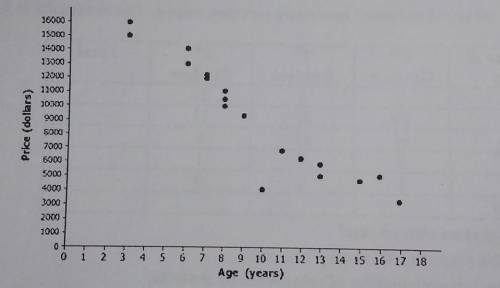
7. Describe the trend you see in the data in the context of the situation.
8. Draw a line of best fit and write an equation that matches it (you'll need the slope and y-intercept).
9. Use your line of best fit to predict the price of a car that is 10 years old.
10. Which variable is the dependent variable? Explain...

Answers: 3


Other questions on the subject: Mathematics
Mathematics, 21.06.2019 19:30, daquanmcqueen77
Are triangles the congruent? write the congruency statement. what is the congruency that proves they are congruent? what is the perimeter of ∆pqr?
Answers: 1
Mathematics, 21.06.2019 20:50, kidpryo1
There are three bags: a (contains 2 white and 4 red balls), b (8 white, 4 red) and c (1 white 3 red). you select one ball at random from each bag, observe that exactly two are white, but forget which ball came from which bag. what is the probability that you selected a white ball from bag a?
Answers: 1
Mathematics, 22.06.2019 00:30, Amholloway13
Given abc find the values of x and y. in your final answer, include all of your calculations.
Answers: 1
You know the right answer?
7. Describe the trend you see in the data in the context of the situation.
8. Draw a line of best f...
Questions in other subjects:
Mathematics, 09.10.2021 19:00

Biology, 09.10.2021 19:00

Chemistry, 09.10.2021 19:00
Biology, 09.10.2021 19:00


