
Mathematics, 02.02.2021 19:10 reycaden
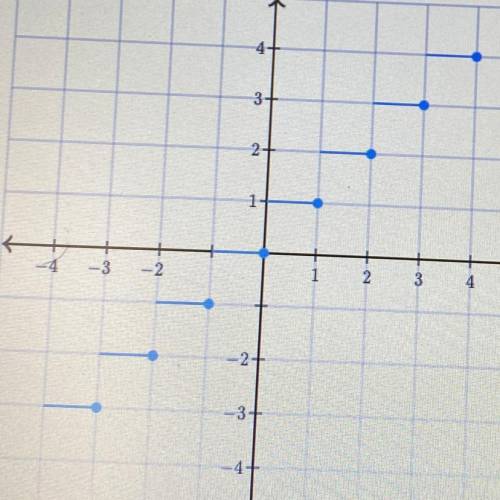
The illustration below shows the graph of y as a function of .
Complete the following sentences based
the graph.
-3 and 2
-2.
• The slope of the graph of the function is equal to for x between 2=
• The slope of the graph is equal to for x between 2 = 3 and 2 = 4.
• The greatest value of y is y
The smallest value of y is y =
.

Answers: 3


Other questions on the subject: Mathematics
Mathematics, 21.06.2019 20:00, stichgotrich7159
Michael is training for a marathon. in his first week he plans to run 8miles. what path should he take
Answers: 1
Mathematics, 21.06.2019 21:30, natalieburnett82
Ihave a triangle with a 60 degree angle. lets use d for that angle. what are the values of e and f if d is 60 degrees? and what do you notice about the values of e and f?
Answers: 2
Mathematics, 22.06.2019 00:00, bri9263
(20 points) a bank has been receiving complaints from real estate agents that their customers have been waiting too long for mortgage confirmations. the bank prides itself on its mortgage application process and decides to investigate the claims. the bank manager takes a random sample of 20 customers whose mortgage applications have been processed in the last 6 months and finds the following wait times (in days): 5, 7, 22, 4, 12, 9, 9, 14, 3, 6, 5, 15, 10, 17, 12, 10, 9, 4, 10, 13 assume that the random variable x measures the number of days a customer waits for mortgage processing at this bank, and assume that x is normally distributed. 2a. find the sample mean of this data (x ě…). 2b. find the sample variance of x. find the variance of x ě…. for (c), (d), and (e), use the appropriate t-distribution 2c. find the 90% confidence interval for the population mean (îľ). 2d. test the hypothesis that îľ is equal to 7 at the 95% confidence level. (should you do a one-tailed or two-tailed test here? ) 2e. what is the approximate p-value of this hypothesis?
Answers: 2
You know the right answer?
The illustration below shows the graph of y as a function of .
Complete the following sentences bas...
Questions in other subjects:


Mathematics, 18.10.2020 04:01
Engineering, 18.10.2020 04:01

Chemistry, 18.10.2020 04:01


