
Mathematics, 02.02.2021 17:00 miyahhh123
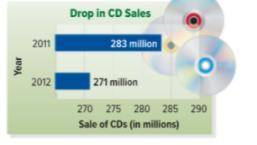
PLEASEEE HELP Use the graph shown to find the percent of change in CD sales from 2011 to 2012?

Answers: 3


Other questions on the subject: Mathematics
Mathematics, 21.06.2019 20:10, tiggyandrep2dbee
Look at the hyperbola graphed below. the hyperbola gets very close to the red lines on the graph, but it never touches them. which term describes each of the red lines? o o o o a. asymptote b. directrix c. focus d. axis
Answers: 3
You know the right answer?
PLEASEEE HELP
Use the graph shown to find the percent of change in CD sales from 2011 to 2012?
Questions in other subjects:


Health, 05.07.2019 03:00
Mathematics, 05.07.2019 03:00


Biology, 05.07.2019 03:00


