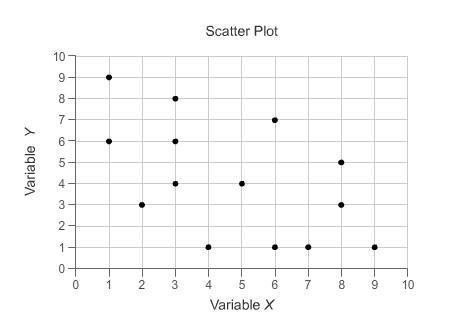
if you have eyes and you can use them efficiently you can see that it just looks like random dots like do a line of best fit and like they're so spread out it's such a weak association you might as well consider it nonexistent
The frequency table shows the results of a survey comparing the number of beach towels sold for full price and at a discount during each of the three summer months. the store owner converts the frequency table to a conditional relative frequency table by row. which value should he use for x? round to the nearest hundredth. 0.89 0.90 0.92 0.96