
Mathematics, 02.02.2021 03:50 penacesar18p9jrdh
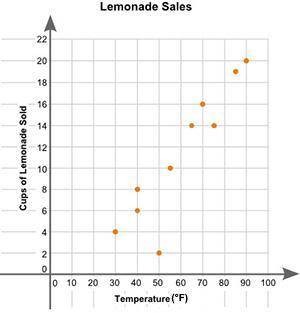
(06.02)Eric plotted the graph below to show the relationship between the temperature of his city and the number of cups of lemonade he sold daily:
Part A: Describe the relationship between the temperature of the city and the number of cups of lemonade sold. (2 points)
Part B: Describe how you can make the line of best fit. Write the approximate slope and y-intercept of the line of best fit. Show your work, including the points that you use to calculate the slope and y-intercept. (3 points)

Answers: 2


Other questions on the subject: Mathematics
Mathematics, 21.06.2019 15:00, mdaniella522
7(x - 2) = 3(x + 4) solve the following equation. then enter your answer in the space provided using mixed number format.
Answers: 2
Mathematics, 21.06.2019 15:10, shamiya15
Polygons efgh and e′f′g′h′ are shown on the coordinate grid: what set of transformations is performed on efgh to form e′f′g′h′? a. a translation 1 unit to the left followed by a 90-degree counterclockwise rotation about the origin b. a translation 1 unit to the right followed by a 90-degree counterclockwise rotation about the origin c. a 90-degree clockwise rotation about the origin followed by a translation 2 units to the right d. a 90-degree clockwise rotation about the origin followed by a translation 2 units to the left
Answers: 1
Mathematics, 21.06.2019 16:10, Calvinailove13
Pls! does anybody know a shortcut for answering these types of questions in the future?
Answers: 3
You know the right answer?
(06.02)Eric plotted the graph below to show the relationship between the temperature of his city and...
Questions in other subjects:


English, 31.07.2019 12:30
English, 31.07.2019 12:30
Mathematics, 31.07.2019 12:30

History, 31.07.2019 12:30
History, 31.07.2019 12:30


