
Mathematics, 01.02.2021 21:40 emanuelmorales1515
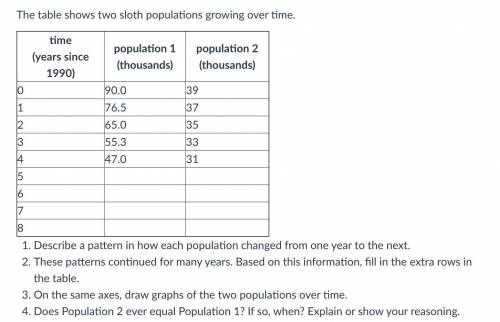
The table shows two sloth populations growing over time.
Describe a pattern in how each population changed from one year to the next.
These patterns continued for many years. Based on this information, fill in the extra rows in the table.
On the same axes, draw graphs of the two populations over time.
Does Population 2 ever equal Population 1? If so, when? Explain or show your reasoning.
look at the picture below

Answers: 1


Other questions on the subject: Mathematics
Mathematics, 21.06.2019 14:30, elijah1090
In each bouquet of flowers, there are 2 roses and 3 white carnations. complete the table to find how many roses and carnations there are in 2 bouquets of flowers.
Answers: 1
Mathematics, 22.06.2019 01:20, ctyrector
Anita has a success rate of 80% on free throws in basketball. she wants to know the estimated probability that she can make exactly four of five free throws in her next game. how can she simulate this scenario? categorize each simulation of this scenario as correct or incorrect.
Answers: 2
You know the right answer?
The table shows two sloth populations growing over time.
Describe a pattern in how each population...
Questions in other subjects:
Mathematics, 04.05.2021 01:20

Social Studies, 04.05.2021 01:20


Computers and Technology, 04.05.2021 01:20
English, 04.05.2021 01:20
Mathematics, 04.05.2021 01:20


