
Mathematics, 01.02.2021 20:20 babyduckies37
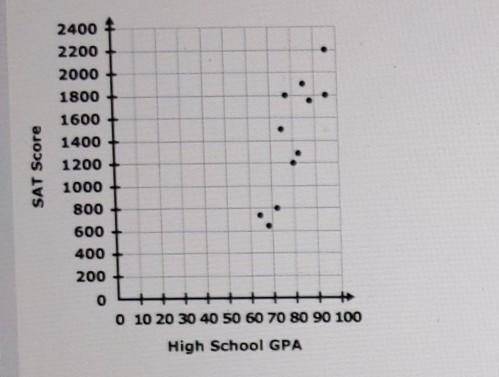
The correlation of SAT scores and grade point averages (GPAs) for a random sample of high school students is represented by the scatterplot below. 2400 2200 2000 1800 SAT Score 1600 1400 1200 1000 800 600 400 200 o 0 10 20 30 40 50 60 70 80 90 100 High School GPA The approximate line of best fit is given by the equation y = 40x - 1800. Based on this trend, which of the following best predicts the SAT score for a high school student with a GPA of 95? 2000 2200 Ο Ο Ο Ο 1980 1895

Answers: 2


Other questions on the subject: Mathematics
Mathematics, 21.06.2019 22:00, afolmar2006
What is the solution to the system of equation graphed belowa.(0,-4)b.(2,5),1),-3)
Answers: 3
Mathematics, 22.06.2019 00:30, dragpack70
Will mark ! (10 points also! ) if x varies inversely with y and x =6 when y= 10, find y when x=8 a. y=4.8 b. y=7.5 c. y=40/3 d. y=4/15
Answers: 1
Mathematics, 22.06.2019 01:00, isabellecannuli
Asmall book publisher knows that 26 books weigh 41 lbs. how much do 40 books weigh?
Answers: 1
Mathematics, 22.06.2019 02:00, powella033
Acompound inequality is graphed, and its graph consists of all real numbers. which open scentence could have resulted in this solution set r> 3 or r< -2. r< 3 or r< -2. r> 3 or r> -2. r< 3 or r> -2 plz asap
Answers: 1
You know the right answer?
The correlation of SAT scores and grade point averages (GPAs) for a random sample of high school stu...
Questions in other subjects:

Computers and Technology, 14.07.2019 06:30

Social Studies, 14.07.2019 06:30
Mathematics, 14.07.2019 06:30


Mathematics, 14.07.2019 06:30


