
Mathematics, 01.02.2021 18:00 KariSupreme
PLEASE HELP
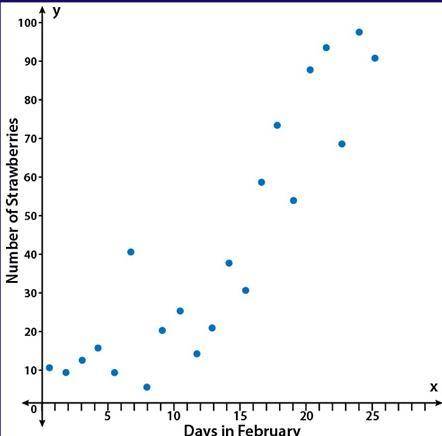
The scatter plot shows the number of strawberries that have been picked on the farm during the month of February:
A scatter plot with points showing an upward trend with points that are moderately spread out from a line of best fit. The y axis is labeled Number of Strawberries and the x axis is labeled Days in February
Part A: Using computer software, a correlation coefficient of r = 0.01 was calculated. Based on the scatter plot, is that an accurate value for this data? Why or why not? (5 points)
Part B: Instead of comparing the number of strawberries picked and the day in February, write a scenario that would be a causal relationship for strawberries picked on the farm. (5 points)

Answers: 1


Other questions on the subject: Mathematics
Mathematics, 21.06.2019 15:50, COOLIOMARIS
Do a swot analysis for the business idea you chose in question 2 above. describe at least 2 strengths, 2 weaknesses, 2 opportunities, and 2 threats for that company idea. (1-8 sentences. 4.0 points)
Answers: 1
Mathematics, 21.06.2019 20:30, makailaaa2
Ateam has p points. p = 3w + d w = wins d = draws a) a football team has 5 wins and 3 draws. how many points does the team have?
Answers: 1
You know the right answer?
PLEASE HELP
The scatter plot shows the number of strawberries that have been picked on the farm du...
Questions in other subjects:

Chemistry, 18.10.2019 16:50


Health, 18.10.2019 16:50

Mathematics, 18.10.2019 16:50
English, 18.10.2019 16:50
Chemistry, 18.10.2019 16:50
Biology, 18.10.2019 16:50


