
Mathematics, 01.02.2021 07:00 kaitlksndj
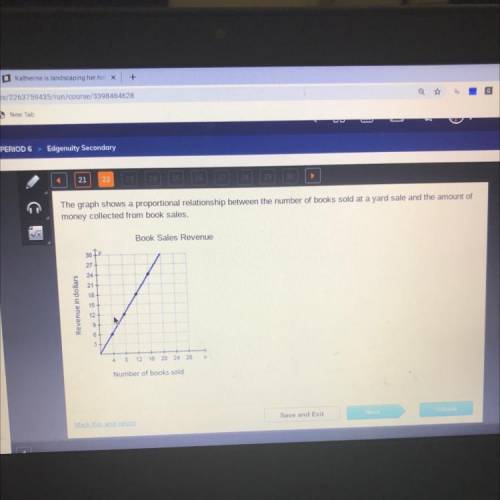
The graph shows a proportional relationship between the number of books sold at a yard sale and the amount of
money collected from book sales.
Book Sales Revenue
30 12
27
24
21
18
Revenue in dollars
15
12
3
4 8 12 16 20 24 28 x
Number of books sold
Save and Exit
SA
Mark this and totum

Answers: 1


Other questions on the subject: Mathematics
Mathematics, 21.06.2019 18:50, casianogabriel2004
Which expression shows the sum of the polynomials with like terms grouped together
Answers: 2
Mathematics, 21.06.2019 22:00, malikxyo224
Rewrite so the subject can be y in the formula d=m-y/y+n
Answers: 1
Mathematics, 21.06.2019 22:30, xandraeden32
Ingredient c: 1/4 cup for 2/3 serving or ingredient d: 1/3 cup for 3/4 serving which unit rate is smaller
Answers: 2
Mathematics, 22.06.2019 02:00, Dweath50
Look at this system of equations. -3x + 3y = 12 y = x + 4 the solution set of this system is best explained by which of these statements? a) the graphs of the equations are the same line because the equations have the same slope and the same y-intercept. the system has infinitely many solutions. b) the graphs of the equations are parallel lines because they have the same slope but different y-intercepts. the system has no solution. c) the graphs of the equations are lines that intersect at one point because the equations have the same slope but different y-intercepts. the system has exactly one solution. d) the graphs of the equations are lines that intersect at one point because the equations have the same slope and the same y-intercept. the system has exactly one solution.
Answers: 2
You know the right answer?
The graph shows a proportional relationship between the number of books sold at a yard sale and the...
Questions in other subjects:

English, 24.05.2021 06:50
English, 24.05.2021 06:50


Chemistry, 24.05.2021 06:50

Business, 24.05.2021 06:50
Mathematics, 24.05.2021 06:50
Mathematics, 24.05.2021 06:50


