Choose the function whose graph is given by:
A. y=tan(x-7)+2
B. y=tan(x-7)-2
C. y=tan(x...

Mathematics, 01.02.2021 04:40 lele2010
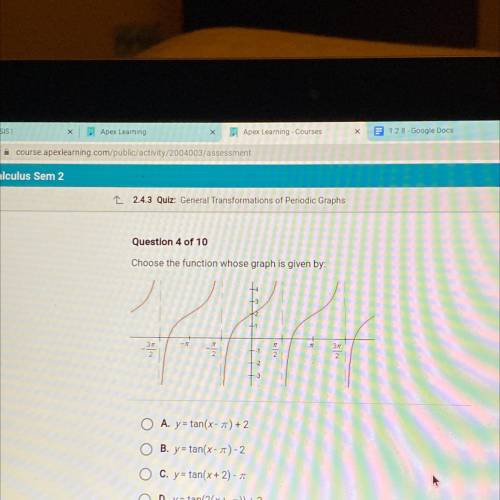
Choose the function whose graph is given by:
A. y=tan(x-7)+2
B. y=tan(x-7)-2
C. y=tan(x + 2) -
D. y=tan(2(x + 7)) + 2

Answers: 2


Other questions on the subject: Mathematics
Mathematics, 21.06.2019 18:30, rachel2735
Can someone check if i did this right since i really want to make sure it’s correct. if you do you so much
Answers: 1
Mathematics, 21.06.2019 20:30, alexialiles19
Max recorded the heights of 500 male humans. he found that the heights were normally distributed around a mean of 177 centimeters. which statements about max’s data must be true? a) the median of max’s data is 250 b) more than half of the data points max recorded were 177 centimeters. c) a data point chosen at random is as likely to be above the mean as it is to be below the mean. d) every height within three standard deviations of the mean is equally likely to be chosen if a data point is selected at random.
Answers: 2
Mathematics, 22.06.2019 02:00, macinnoodlezz
What are linear equations? could'ya explain too me, ? ! and how do you see what graph is a proportional relationship?
Answers: 2
Mathematics, 22.06.2019 03:00, jordivivar74
Pranav and molly are selling pies for a school fundraiser. customers can buy blueberry pies and pumpkin pies. pranav sold 6 blueberry pies and 4 pumpkin pies for a total of $106. molly sold 6 blueberry pies and 3 pumpkin pies for a total of $90. find the cost of each of one blueberry pie and one pumpkin pie
Answers: 2
You know the right answer?
Questions in other subjects:


Biology, 18.03.2020 01:51


