
Mathematics, 01.02.2021 01:00 Amholloway13
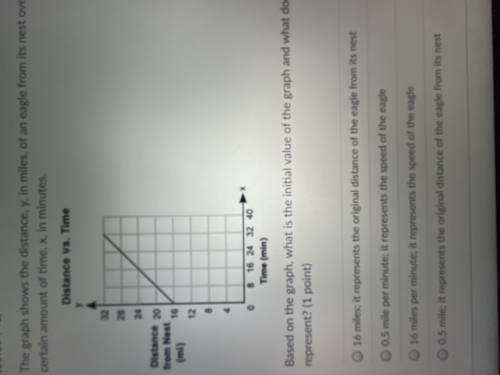
The graph shows the distance, y, in miles, of an eagle from its nest over a certain amount of time, x in minutes. Based on the graph, what is the initial value of the graph and what does it represent?

Answers: 2


Other questions on the subject: Mathematics
Mathematics, 21.06.2019 19:40, marshallmattah
Suppose that 3% of all athletes are using the endurance-enhancing hormone epo (you should be able to simply compute the percentage of all athletes that are not using epo). for our purposes, a “positive” test result is one that indicates presence of epo in an athlete’s bloodstream. the probability of a positive result, given the presence of epo is .99. the probability of a negative result, when epo is not present, is .90. what is the probability that a randomly selected athlete tests positive for epo? 0.0297
Answers: 1
Mathematics, 21.06.2019 20:30, natebarr17
The interior angles formed by the side of a hexagon have measures of them up to 720° what is the measure of angle a
Answers: 2
Mathematics, 21.06.2019 22:20, guesswhoitis21
Line segment eg is partitioned by point f in the ratio 1: 1. point e is at e (0, 4), and point f is at (1, 3). what are the coordinates of point g? (−1, 5) (2, 2) (3, 1) (4, 0)
Answers: 2
Mathematics, 21.06.2019 23:20, coralstoner6793
This graph shows which inequality? a ≤ –3 a > –3 a ≥ –3 a < –3
Answers: 1
You know the right answer?
The graph shows the distance, y, in miles, of an eagle from its nest over a certain amount of time,...
Questions in other subjects:


Mathematics, 24.07.2019 11:00

Mathematics, 24.07.2019 11:00


