
Mathematics, 31.01.2021 23:10 JDKozlova
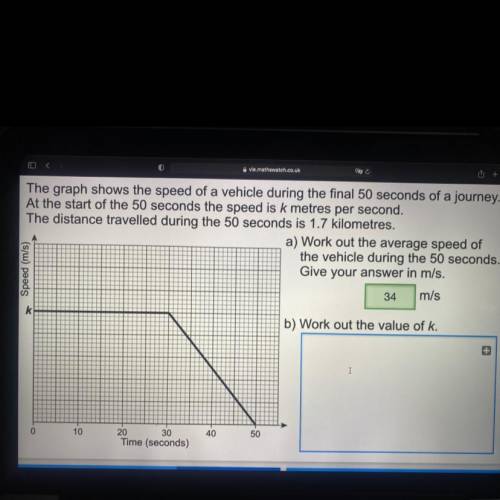
The graph shows the speed of a vehicle during the final 50 seconds of a journey.
At the start of the 50 seconds the speed is k metres per second.
The distance travelled during the 50 seconds is 1.7 kilometres.
a) Work out the average speed of
the vehicle during the 50 seconds.
Give your answer in m/s.
34 m/s
* Speed (m/s)
b) Work out the value of k.
10
40
50
20 30
Time (seconds)

Answers: 3


Other questions on the subject: Mathematics
Mathematics, 21.06.2019 20:30, chicalapingpon1938
Janet is rolling a number cube with the numbers one through six she record the numbers after each row if she rolls of keep 48 times how many times should she expect to roll a 4
Answers: 1
Mathematics, 21.06.2019 23:10, angelthompson2018
Aramp rises 4 feet over a distance of 10 feet. what is the length of the ramp?
Answers: 3
You know the right answer?
The graph shows the speed of a vehicle during the final 50 seconds of a journey.
At the start of th...
Questions in other subjects:


Chemistry, 01.07.2020 15:01

Physics, 01.07.2020 15:01
Mathematics, 01.07.2020 15:01


