
Mathematics, 30.01.2021 04:40 Skybil1204
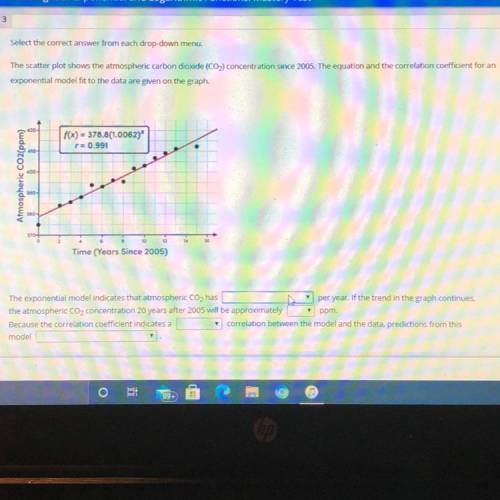
The scatter plot shows the atmospheric carbon dioxide (CO2) concentration since 2005. The equation and the correlation coefficient for an
exponential model fit to the data are given on the graph.
420-
f(x) = 378.8(1.0062)*
r= 0.991
400
Atmospheric
CO2(ppm
390
380
370-
10 12
Time (Years Since 2005)
The exponential model indicates that atmospheric CO2 has
per year. If the trend in the graph continues,
the atmospheric CO2 concentration 20 years after 2005 will be approximately ppm.
Because the correlation coefficient indicates a
correlation between the model and the data, predictions from this
model
Y

Answers: 1


Other questions on the subject: Mathematics
You know the right answer?
The scatter plot shows the atmospheric carbon dioxide (CO2) concentration since 2005. The equation a...
Questions in other subjects:
Mathematics, 19.05.2020 18:05
Mathematics, 19.05.2020 18:05

Mathematics, 19.05.2020 18:06
Mathematics, 19.05.2020 18:06

English, 19.05.2020 18:06

Social Studies, 19.05.2020 18:06


